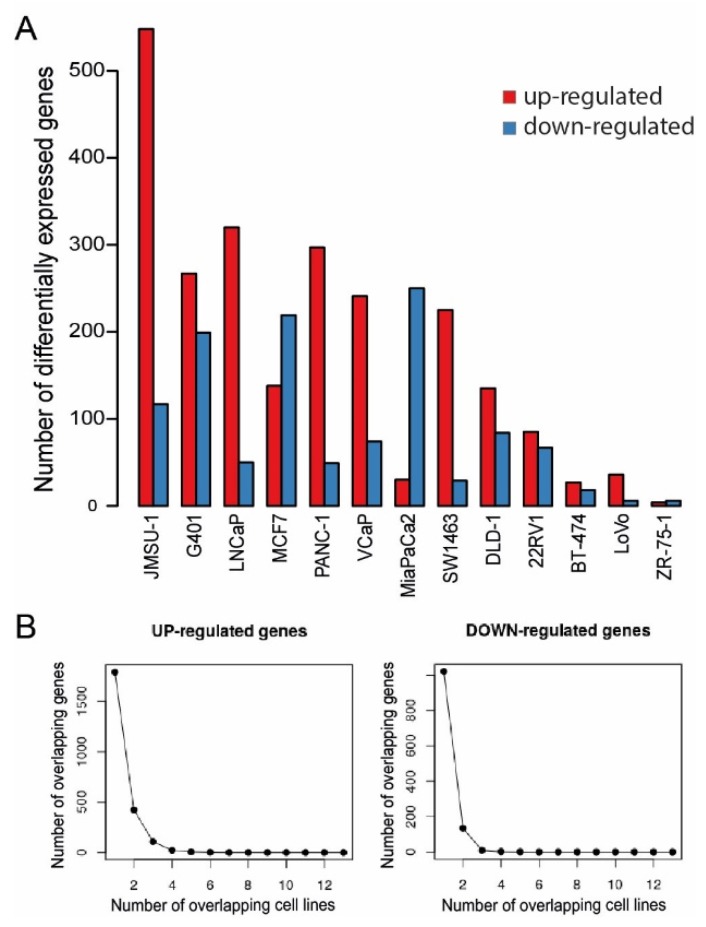
Figure 3.
Differential gene expression effects of BAY-155 across several solid cancer cell models. (A) Number of genes up-regulated (red bars) and down-regulated (blue bars) upon treatment by BAY-155 in the indicated cell models (logFC > 1 or logFC < −1 and FDR < 0.1). (B) Number of overlapping up-regulated (left) or down-regulated (right) genes in cell lines treated with BAY-155.

