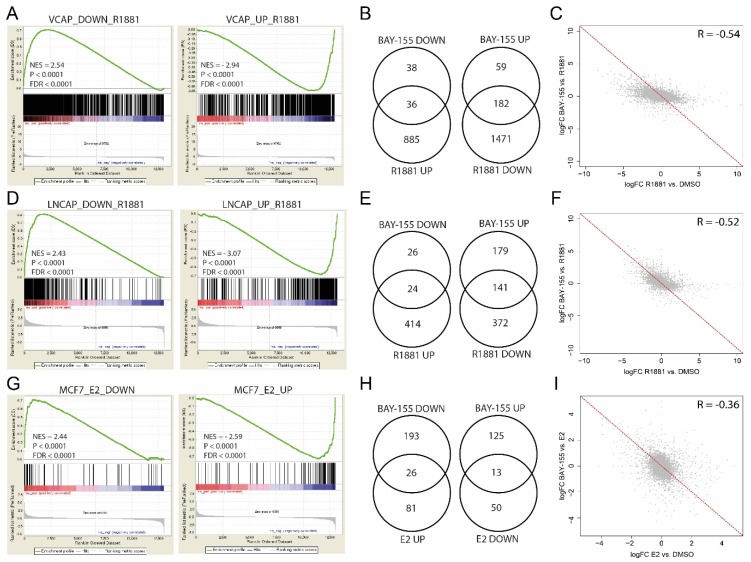
Figure 4.
Differential gene expression effects of BAY-155 in prostate and breast cancer models. (A,D) Gene Set Enrichment Analysis (GSEA) of androgen up-regulated and down-regulated genes after R1881-induction of BAY-155 treated VCaP (A) and LNCaP (D) cells. (B,E) Venn-diagrams representing the overlap between BAY-155 and R1881 differentially regulated genes in VCaP (B) and LNCaP (E) cells. (C,F) LogFC correlation of R1881-induced gene expression changes and BAY-155 treatment induced gene expression changes in VCaP (C) and LNCaP (F) cells. (G) GSEA of estrogen up-regulated and down-regulated genes after E2-induction of BAY-155 treated MCF7 cells. (H) Venn-diagrams representing the overlap between BAY-155 and E2 differentially regulated genes in MCF7 cells. (I) LogFC correlation of E2-induced gene expression changes and BAY-155 treatment induced gene expression changes in MCF7 cells. Genes with Log2FC > 1 or < −1 and FDR < 0.1 were considered significantly changed.

