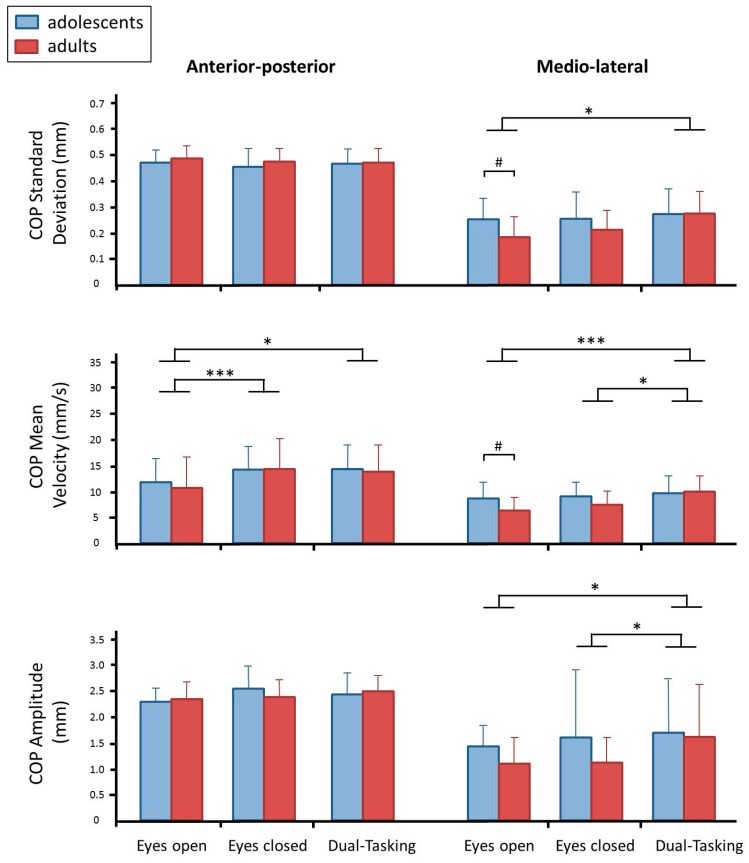
Figure 1.
Characterization of the center of pressure (COP) motion: normalized standard deviation (SD), mean velocity, and amplitude. The anterior-posterior motion is shown on the left, the medio-lateral on the right. Blue bars represent the adolescents, red bars represent the adults (mean ± standard error). Asterisks indicate significance between trials (p < 0.001 ***, p < 0.05 *) and hashtags between groups (p < 0.05 #).

