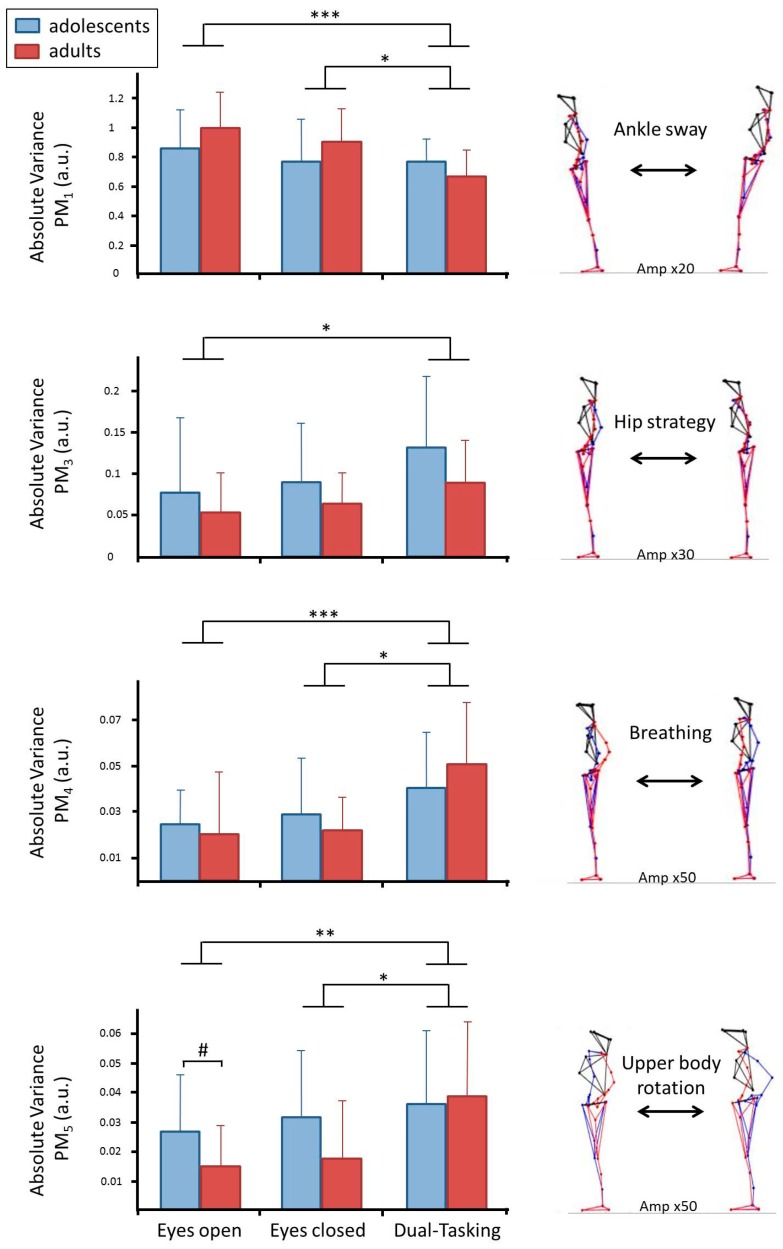
Figure 2.
Results for PM1, PM3, PM4, PM5 in variable aVark. Lines with asterisks (p < 0.001 ***; p = 0.001 **; p < 0.05 *) indicate significant differences between trials and hashtags between groups (p < 0.05 #). Blue bars represent adolescents, red bars adults (mean ± standard error). A visualization of the movement component through their extreme positions is included on the right. For better clarity, the deviation from the mean posture is amplified by the specified factor Amp.

