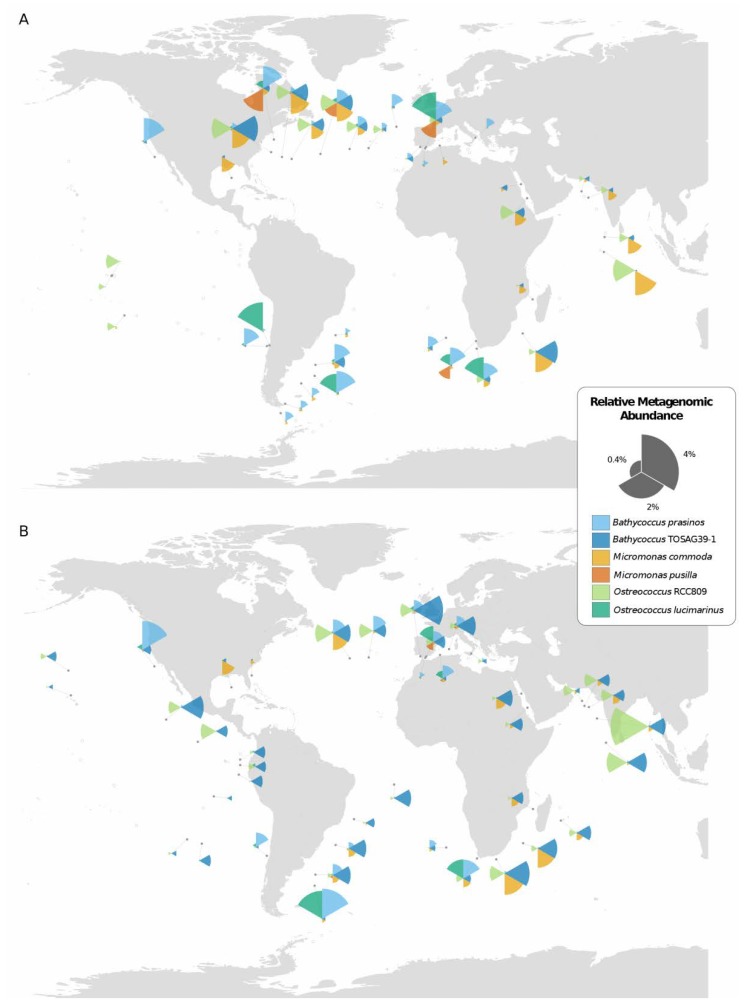
Figure 1.
Geographical distribution of the six Mamiellales genomes in Tara Oceans stations from (A) surface and (B) deep-chlorophyll maximum (DCM) waters, as inferred from the relative abundance of recruited metagenomic reads. Samples with less than 0.1% relative abundance of a species are displayed as an empty circle. The sizes of the segments of coxcomb charts indicate the relative genomic abundances of the corresponding Mamiellales.

