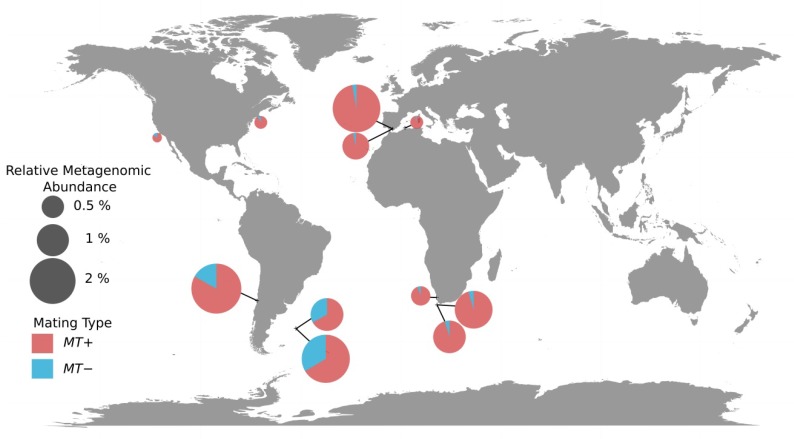
Figure 4.
Geographical distribution of the two mating types of Ostreococcus lucimarinus in Tara Oceans stations. Each pie-chart represents a sample with a size relative to the relative metagenomic abundance of whole genome, and shows the average proportions of the two mating types genes. Ratios were determined using the MT genes method (Methods).

