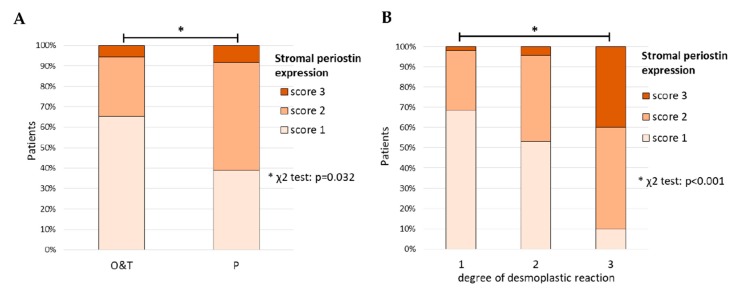
Figure 6.
(A) Correlation between periostin expression and the anatomical source of tumor specimen (χ2 test, p = 0.032). P—samples derived from peritoneal/omental metastatic disease; O—primary tumor samples (containing visible ovarian structures); T—samples containing only tumor tissue; (B) Correlation between stromal periostin expression and the degree of desmoplastic reaction (χ2 test, p < 0.001). *—denotes p < 0.05.

