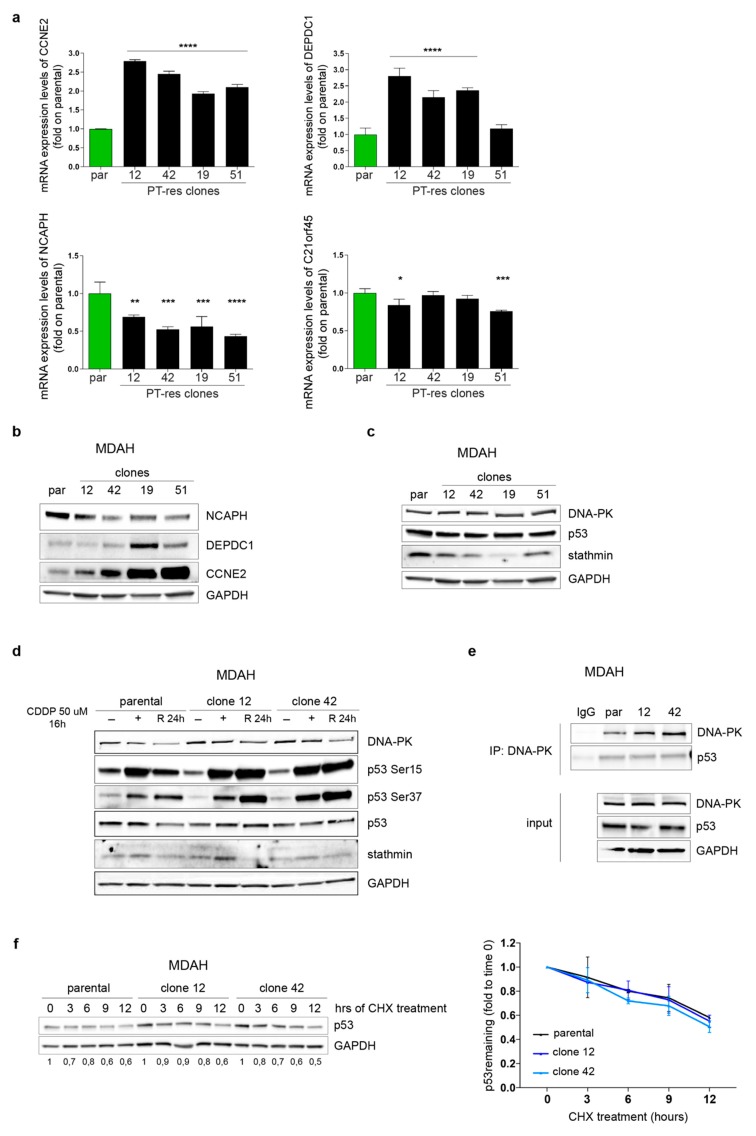
Figure 3.
p53MUT downstream targets are differently expressed in PT-res clones (a) Graphs reporting the normalized (to GAPDH) expression of the indicated genes in MDAH parental and PT-res clones evaluated by qRT-PCR analyses. Data are expressed as fold of mRNA expression in PT-res cells respect to parental cells and represent the mean (±SD) of at least of three independent experiments. Statistical significance was determined by one-way ANOVA test; a multiple comparison analysis was done to determine significant differences among groups (* p < 0.05 and ** p < 0.01 and *** p < 0.001 and **** p < 0.0001). (b,c) Western Blot analysis evaluating the expression of NCAPH, DEPDC1, and CCNE2 (b) and DNA-PK, p53, and stathmin (c) in parental and PT-res clones, as indicated. (d) Western Blot analysis evaluating the expression of DNA-PK, total and phosphorylated (Ser15 and Ser37), p53 and stathmin in parental and PT-res clones (#12 and #42) not treated (−) or treated with CDDP for 16 h (+) and allowed to repair for 24 h (R24h). (e) Co-immunoprecipitation analyses of endogenous DNA-PK and p53 proteins in parental and PT-res single clones (#12 and #42). Input shows the expression of the indicated proteins in the correspondent lysates; IgG represents the control IP using an unrelated antibody. (f) Western blot analysis of p53 expression in parental and PT-res single clones (#12 and #42) treated with cycloheximide (CHX) for the indicated times. The graph on the right reports the p53 expression as remaining fraction respect to T0 (mean ± SD of three different experiments), normalized respect to GAPDH expression. In the figure GAPDH was used as loading control.

