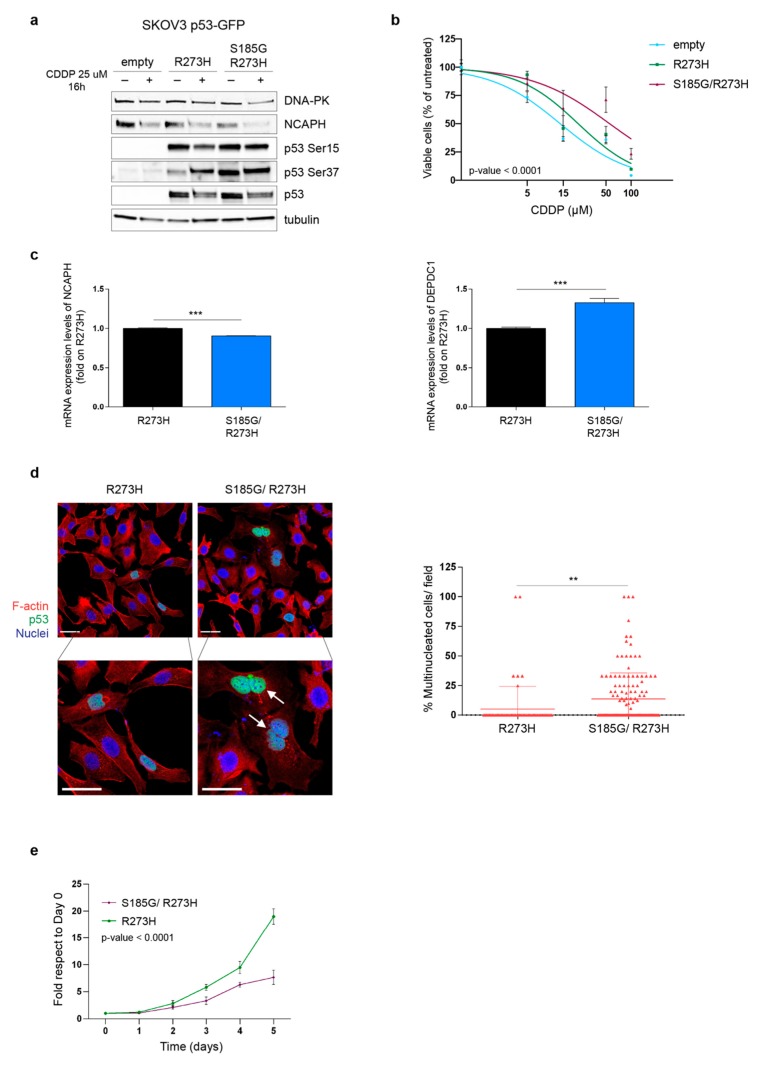
Figure 5.
p53 S185G R273H expression confers resistance to PT-induced death (a) Western blot analyses evaluating the expression of DNA-PK, NCAPH, phosphorylated p53 (Ser15 and Ser37) in SKOV-3 cells stably transfected with pEGFP-p53R273H or pEGFP-p53S185G/R273H double mutant. Cells were treated or not with CDDP for 16 h. Tubulin was used as a loading control. (b) Nonlinear regression analyses of cell viability assay of cells described in (a) and treated with increasing doses of cisplatin (CDDP) for 72 h. Data are expressed as percentage of viable cells respect to the untreated cells and represent the mean (±SD) of 3 biological replicates. Fisher’s exact test was used to calculate the global p-value reported in the graph. (c) Representative images of SKOV-3 cells transfected with p53R273H or p53S185G/R273H double mutant stained for F-actin (red) and p53 (green). Nuclei are pseudo colored in blue (TO-PRO-3). Bottom panels show the indicated zoomed area for each condition (2× zoom) in which white arrows indicate multinucleated cells. Scale bar = 44 μm. On the right, the number of multinucleated cells counted among p53 positive cells/field is reported (mean ± SD). The entire coverslips were counted. (d) qRT-PCR analyses evaluating the expression of NCAPH and DEPDC1 in SKOV-3 cells transfected with p53R273H or p53S185G/R273H. Data are expressed as fold of mRNA expression in double mutant expressing cells respect to single mutant expressing cells and represent the mean (±SD) of three independent experiments. In (c,d), statistical significance was determined by a two-tailed unpaired Student’s t-test (** p < 0.01 and *** p < 0.001). (e) Growth curves of SKOV-3 cells stably transfected with p53R273H or p53 S185G/R273H double mutant. Data are expressed as fold increase with respect to day 0. Global statistical significance was determined by two-way ANOVA test.

