Figure 1.
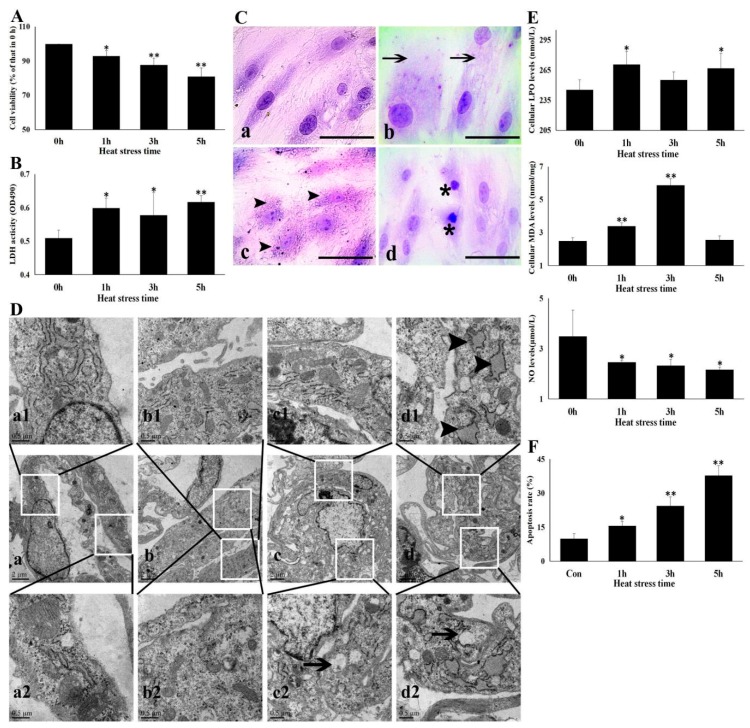
Heat stress damaged CMVECs. The CMVECs were exposed to heat stress for different amounts of time to observe cell injury. Data represent the means ± SD for three independent experiments. (A) CCK-8 test was used to detect cell viability. (B) LDH levels in the cell supernatant were analyzed to observe the cytomembrane injury. (C) Cytopathological observations were conducted under the light microscope. a–d show the morphology of cells exposed to heat stress of 0 h, 1 h, 3 h, and 5 h, respectively, after hematoxylin eosin (H. E.) staining. Bar = 20 µm. Arrows indicate swelling cells, arrowhead points to degeneration and loss of cytoplasm, and asterisk mark necrosis; (D) Ultrastructural damage of CMVECs was observed using TEM. a–d show the overall appearance of cells exposed to heat stress of 0 h, 1 h, 3 h, and 5 h, respectively; a1–d1 show details of the endoplasmic reticulum; and a2–d2 show the changes of the mitochondrion. Bar = 0.5 µm. (E) Specific kits were used to detect cellular oxidative stress levels and NO release in the supernatant. (F) Flow cytometry was used to detect the cellular apoptosis rate at different heat stress times. The differences of the data of cells with different heat stress times vs. that of the non-stressed cells are indicated by * p < 0.05 and ** p < 0.01.

