Figure 3.
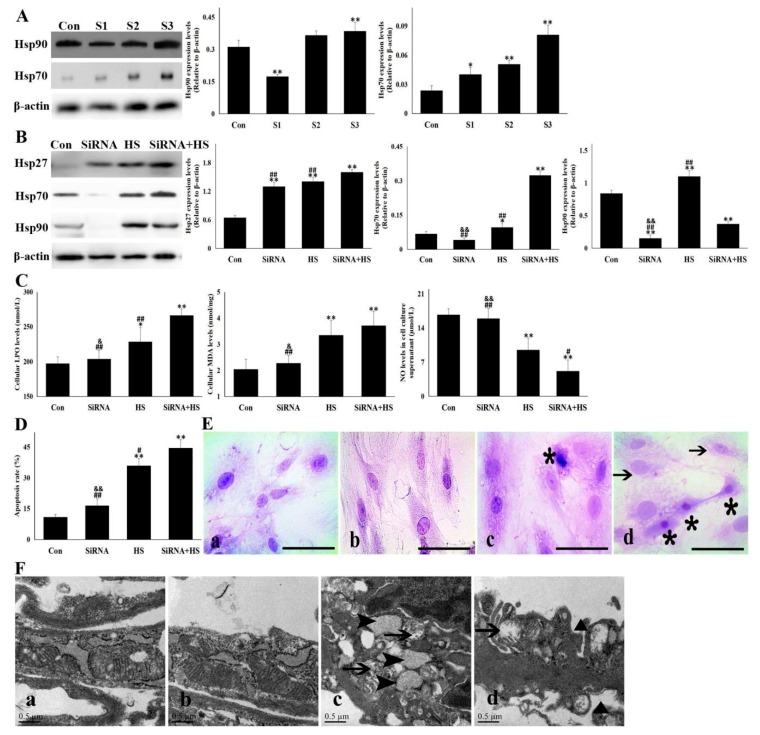
Knockdown of Hsp90 aggravated the cellular damage induced by heat stress. Data represent the means ± SD for three independent experiments. (A) CMVECs were transfected with a three SiRNA sequence (S1–S3) to inhibit Hsp90 expression and were harvested for detecting Hsp90 and Hsp70 levels with Western blot. The relative abundance of the tested proteins was normalized to that of β-actin. (B–F) CMVEC cells with or without Hsp90-SiRNA transfection were treated with heat stress for 5 h and harvested for corresponding detection: (B) Hsp27, Hsp70 and Hsp90 levels with Western blot analysis. The relative abundance of the tested proteins was normalized to that of β-actin. (C) The specific kits were used to detect cellular oxidative stress levels and NO release in the supernatant. (D) Flow cytometry was used to detect the cellular apoptosis rate. (E) H.E. staining was conducted and observed under the light microscope. a–d shows the representative pictures from Con, SiRNA, HS, and SiRNA + HS, respectively. Bar = 20 µm. Arrows point to the loss of cytoplasm, and asterisk mark necrosis. (F) Ultrastructural damage of CMVECs was observed using TEM. a–d shows the representative pictures from Con, SiRNA, HS, and SiRNA + HS, respectively. bar = 0.5 µm. Arrows indicate excessively swollen mitochondria, asterisk point to ballooning endoplasmic reticulum, and a black triangle marks the depressed or indented cytomembranes. Con, cells without SiRNA transfection and heat stress; SiRNA, cells transfected with SiRNA; HS, heat-stressed cells without SiRNA transfection; SiRNA + HS, heat-stressed cells following SiRNA transfection. The differences of the data of cells with different treatments vs. that of the Con are indicated by * p < 0.05 and ** p < 0.01. The differences of the data of cells treated by SiRNA + HS vs. that in SiRNA or HS are indicated by # p < 0.05 and ## p < 0.01. The difference of the data of cells treated by SiRNA vs. that in HS is indicated by & p < 0.05 and && p < 0.01.

