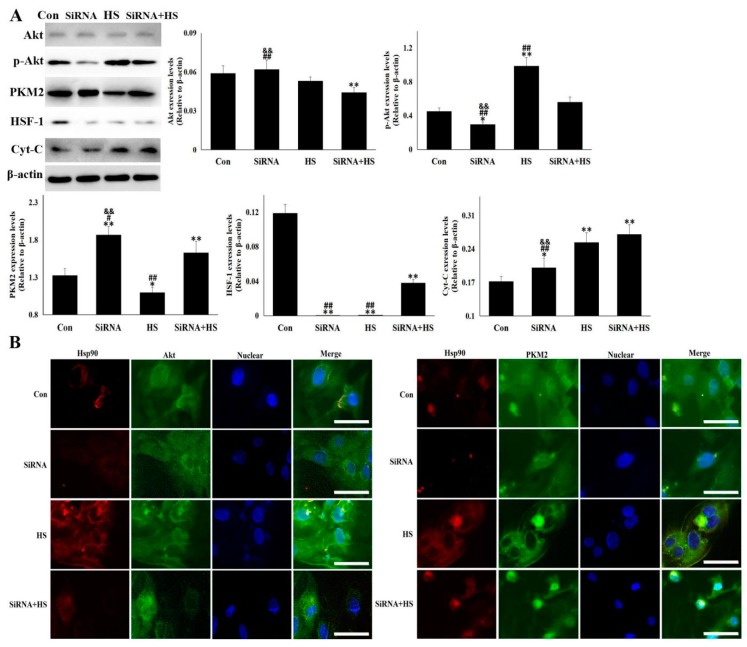
Figure 4.
Akt and PKM2 were regulated differently by Hsp90. Western blot analysis and immunocytochemistry were performed with the indicated antibodies. Data represent the means ± SD for three independent experiments. (A) CMVECs were treated with or without SiRNA followed by heat stress of 5 h or not. Total proteins were used for semi-quantitative detection of the corresponding protein. The relative abundance of the tested proteins was normalized to that of β-actin. (B) CMVECs were treated with or without SiRNA followed by heat stress for 5 h or not. Immunofluorescence was performed using anti-Hsp90, anti-Akt and anti-PKM2 antibodies. Representative images were presented from Con, SiRNA, HS, and SiRNA + HS (Hsp90: red fluorescence, Akt/PKM2: green fluorescence, nucleus: blue fluorescence, the merged signals of Hsp90 with Akt/PKM2 in the cytoplasm: yellow fluorescence). Bar = 20 µm. Con, cells without SiRNA transfection and heat stress; SiRNA, cells transfected with SiRNA; HS, heat-stressed cells without SiRNA transfection; SiRNA + HS, heat-stressed cells following SiRNA transfection. The differences of the data of cells with different treatment vs. that of the Con are indicated by * p < 0.05 and ** p < 0.01. The differences of the data of cells treated by SiRNA+HS vs. that in SiRNA or HS are indicated by # p < 0.05 and ## p < 0.01. The difference of the data of cells treated by SiRNA vs. that in HS is indicated by & p < 0.05 and && p < 0.01.

