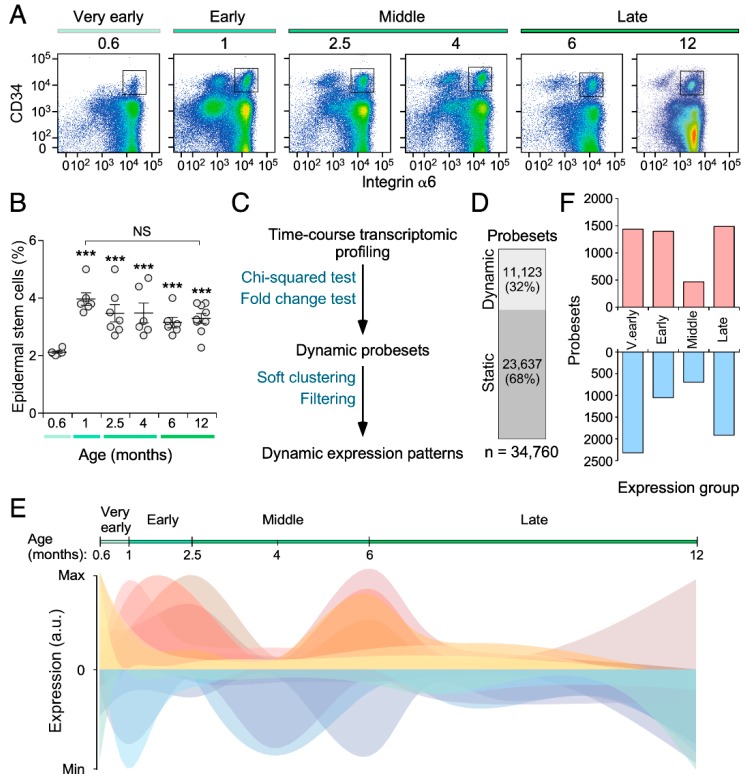
Figure 1.
The transcriptome of skin stem cells fluctuates in an age-dependent manner. (A) Representative flow cytometry scatter plots showing the different epidermal populations according to CD34 and integrin α6 expression at the indicated age points (top). The classification in “very early” (18-day-old), “early” (30-day-old), “middle” (2.5- to 4-month-old), and “late” (6- to 12-month-old) populations is also indicated (top). The gate used for the isolation of basal bulge epidermal stem cell population is depicted with a square. (B) Quantitation of the abundance of the CD34+ Itgα6+ SSC pools in the skin of mice at the indicated ages. ***, p < 0.001; NS, not statistically significant (ANOVA and Dunnett’s tests, n = 6 (18-day-old mice), 6 (30-day-old mice), 7 (2.5-month-old mice), 6 (4-month-old mice), 6 (6-month-old mice), 9 (12-month-old mice). The correlation with the age intervals (“very early”, “early”, “middle”, “late”) is indicated with colored bars as in (A) (bottom). Data represent the mean ± SEM. (C) Scheme representing the bioinformatic pipeline followed to identify dynamic expression patterns of CD34+ Itgα6+ SSCs. (D) Distribution of the 34,760 probesets of the Affymetrix Mouse Gene 1.0 ST array between the dynamic and static groups. (E) Graphical representation of the time-dependent fluctuation of the 14 nonredundant expression patterns of SSCs described in the main text. (F) Number of dynamic probesets found in the “very early” (V. early), “early”, “middle”, and “late” age time-points. Bar color indicates positively (red) and negatively (blue) expression enrichment of probesets against the baseline.

