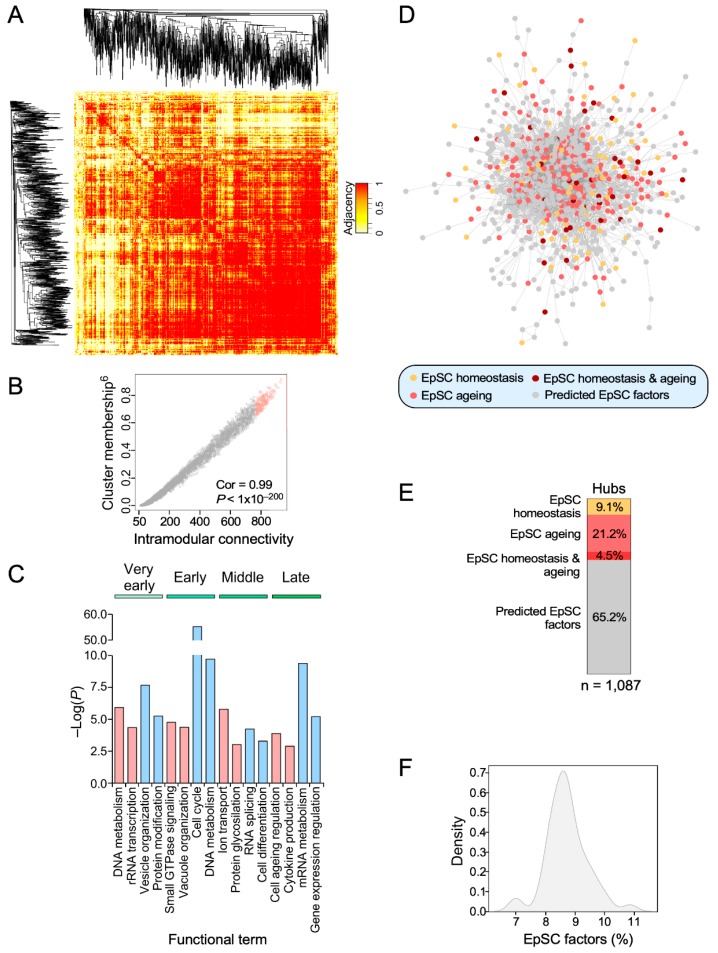
Figure 4.
Identification of age-dependent mRNA-based hubs in SSCs. (A) Representative example of the adjacency heatmaps computed for each expression pattern using the WGCNA R package. Red areas indicate the presence of probesets that are highly correlated transcriptionally. Probeset clustering according to adjacency is depicted on the sides of the heatmap. (B) Representative example of a scatter plot showing the direct relationship between the cluster membership and the intramodular connectivity scores among the probesets within each expression pattern. The Pearson correlation coefficient with the corresponding p value is indicated. Identified hubs are highlighted in color. (C) Main functional terms derived from the gene ontology analysis of the identified hub genes for each expression pattern. Positive (“+”) and negative (“−”) enrichments against baseline are indicated. (D) Association network of the hubs identified in this study. Hubs that have not been previously associated with SSC homeostasis and/or ageing are indicated in gray color. (E) Percentage of the hubs identified in this study that have been associated with SSC homeostasis and/or ageing. Color coding is the same as in (D). (F) Density plot showing the percentage of genes associated to SSC homeostasis and/or ageing that are contained in random sets of 1087 genes (n = 50).

