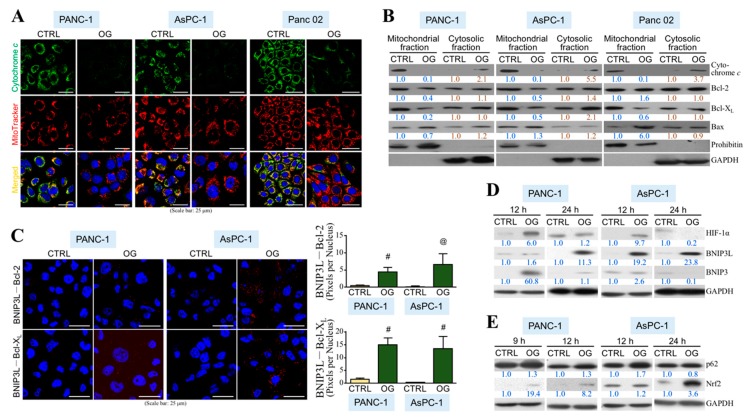
Figure 2.
OG induces physical associations of BNIP3L with Bcl-2 and Bcl-XL to facilitate mitochondrial cytochrome c release. (A) Immunofluorescent staining of cytochrome c and mitochondria in the PANC-1, AsPC-1, and Panc 02 cells treated 24 h with DMSO or OG (50, 50, and 5 μM for PANC-1, AsPC-1, and Panc 02 cells, respectively). Nuclei were stained with DAPI. (B) Immunoblot analyses of cytochrome c, Bcl-2, Bcl-XL, Bax, and prohibitin levels of the mitochondrial and cytosolic fractions isolated from the PANC-1, AsPC-1, and Panc 02 cells treated with DMSO or OG for 24 h. Band intensities were quantified using ImageJ software (National Institutes of Health, Bethesda, MD, USA). Relative levels were denoted after normalization to prohibitin (mitochondrial fraction) or GAPDH (cytosolic fraction). (C) Proximity ligation assay (PLA) showing physical associations of BNIP3L with Bcl-2 and Bcl-XL in the PANC-1 and AsPC-1 cells treated with 50 μM of OG for 24 h. Nuclei were stained with DAPI. Quantitative data are mean ± SD of 3 independent experiments. @ p < 0.01 and # p < 0.001 when compared with “CTRL” group. (D) Immunoblot analyses of HIF-1α, BNIP3L, and BNIP3 levels of the PANC-1 and AsPC-1 cells treated with DMSO or OG for 12 or 24 h. Relative levels were presented after normalization to GAPDH. (E) Immunoblot analyses of p62 and Nrf2 levels of the PANC-1 and AsPC-1 cells treated with DMSO or OG for 9, 12, or 24 h. PANC-1 cells had a higher p62 basal level compared with AsPC-1 cells and showed a little increase in response to OG treatment at any time point. Unlike PANC-1 cells, AsPC-1 cells exhibited a transient p62 induction at 12-h OG treatment.

