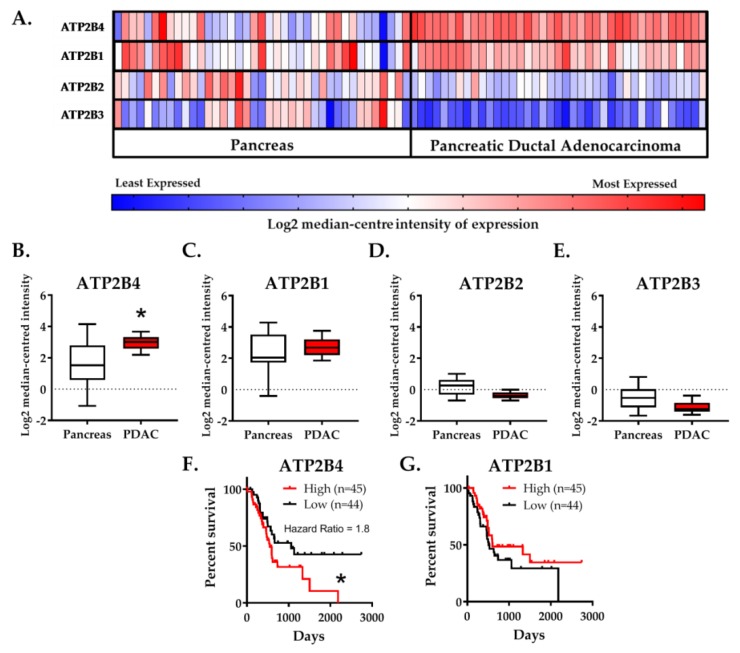
Figure 1.
Elevated PMCA4 mRNA expression (ATP2B4) in PDAC is correlated with low patient survival. (A–E) Badea Pancreas (2008) gene chip microarray data, comparing resected PDAC tumor and healthy pancreatic tissue obtained from matched tumor margin (n = 39), was obtained from Oncomine open-source database. (A) Heat map of ATP2B1–4 gene expression in healthy pancreatic tissue and PDAC tumor (n = 39). Heat map colors, ranging from least expressed (blue) to most-expressed (red), depicts relative Log2 median-centered intensity within rows. Heat map colors cannot be compared between rows. Gene expression based on the Log2 median-centered intensity of (B) ATP2B4, (C) ATP2B1, (D) ATP2B2 and (E) ATP2B3 are individually presented as box and whisker plots. The whiskers indicate 10–90 percentile of the data range. Statistical comparison between PDAC and healthy pancreas tissue were analyzed using Wilcoxon matched-pairs sign rank test. (F,G) PDAC patient survival data were sourced from TCGA-PAAD (n = 176), through The Human Protein Atlas database (January 2019, www.proteinatlas.org). The cohort of 176 PDAC patients was divided into quartiles based on the median-centered gene expression (fragments per kilobase of transcript per million mapped reads; FPKM) into either low (25 percentile) and high (75 percentile) gene expression. Kaplan–Meier survival curves correlating the survival of PDAC patients to the low (black) or high (red) expression of (F) ATP2B4 and (G) ATP2B1. The entire survival outcome curve of the high and low ATP2B4 expressions were used for statistical analysis; the survival outcomes of each group were compared using a log-rank test (Mantel-Cox test). * represents statistical significance where p < 0.05.

