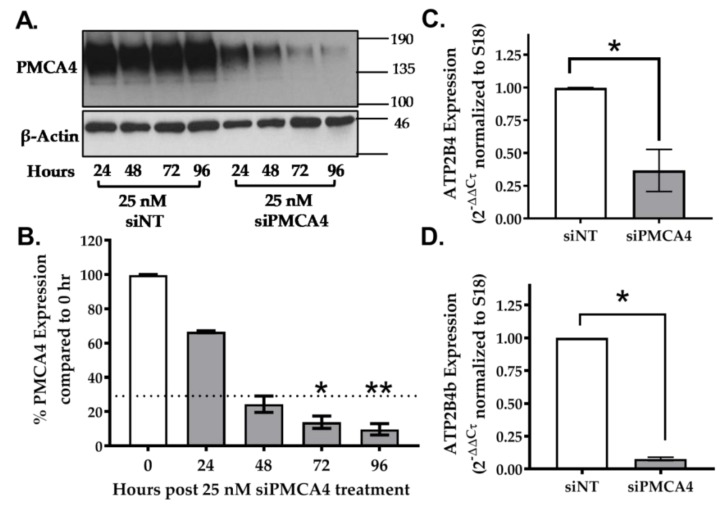
Figure 3.
siRNA knockdown of PMCA4 in MIA PaCa-2 PDAC cells. (A) Representative Western immunoblotting comparing PMCA4 protein expression in MIA PaCa-2 cells after 24–96 h of treatment with siNT (control) and siPMCA4 (PMCA4 knockdown). (B) PMCA4 protein expression of siPMCA4 treated cells was quantified from Western blot bands and normalized to β-Actin (n = 3). Statistical comparison was made using the Kruskal–Wallis test with Dunn’s multiple comparison test, comparing 0-hour control to 24–96 h post-siPMCA4 treatment conditions. (C) The relative expression of ATP2B4 (PMCA4 mRNA) and (D) ATP2B4b (PMCA4b mRNA) were examined after 48 h of siRNA treatment by RT-qPCR. The expressions of target mRNA were normalized to S18 rRNA and expressed as 2−(ΔΔCτ). Data are shown as mean ± SEM. (n = 4, 4 replicates per treatment condition). Comparisons were made between siNT control and siPMCA4 treated cells at matching time points post-drug treatment using Mann–Whitney U-test (Unpaired, non-parametric rank test). * and ** represents statistically significant difference where p < 0.05 and p < 0.01, respectively.

