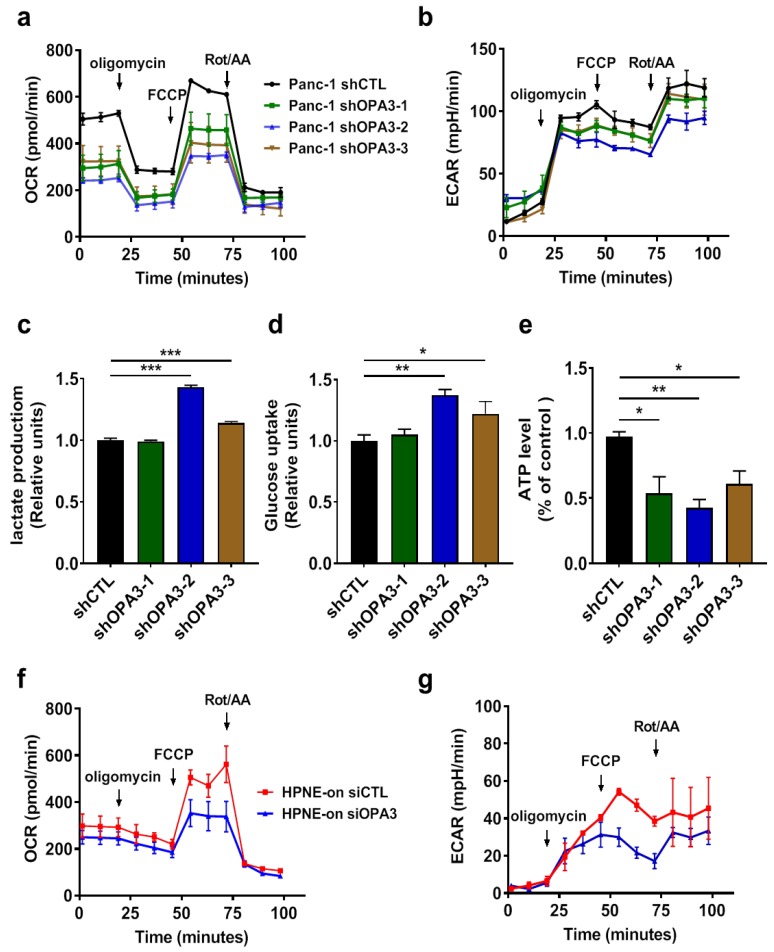
Figure 3.
Silencing of OPA3 expression alters mitochondrial function in Panc-1 cells: (a,b) Real-time measurement of OCR and ECAR for Panc-1 cells using the Seahorse analyzer. (c,d) Lactate and glucose contents were quantified in culture medium of Panc-1 OPA3-shRNA cells. (e) Intracellular ATP content was quantified in Panc-1 OPA3-shRNA cells. (f,g) Real-time measurement of OCR and ECAR for HPNE/K-rasG12D cells using the Seahorse analyzer. HPNE/ K-rasG12D cell line was transfected with control siRNA (siCTL) or OPA3-siRNA for 24 h and then incubated with doxycycline for additional 24 h. Statistics: data are mean ± S.E.M. (n = 3); one-way ANOVA followed by Dunnett post hoc test (compared to “shCTL”) for (c–e). * p < 0.05, ** p < 0.01 and *** p < 0.001. Abbreviations: AA: antimycin A; ECAR: extracellular acidification rate; FCCP: carbonyl cyanide p-trifluoromethoxyphenylhydrazone; OCR: oxygen consumption rate; OPA3: optic atrophy protein 3; Rot: rotenone; shCTL: control shRNA; shOPA3: shRNA against human OPA3; siCTL: control siRNA; and siOPA3: siRNA against human OPA3.

