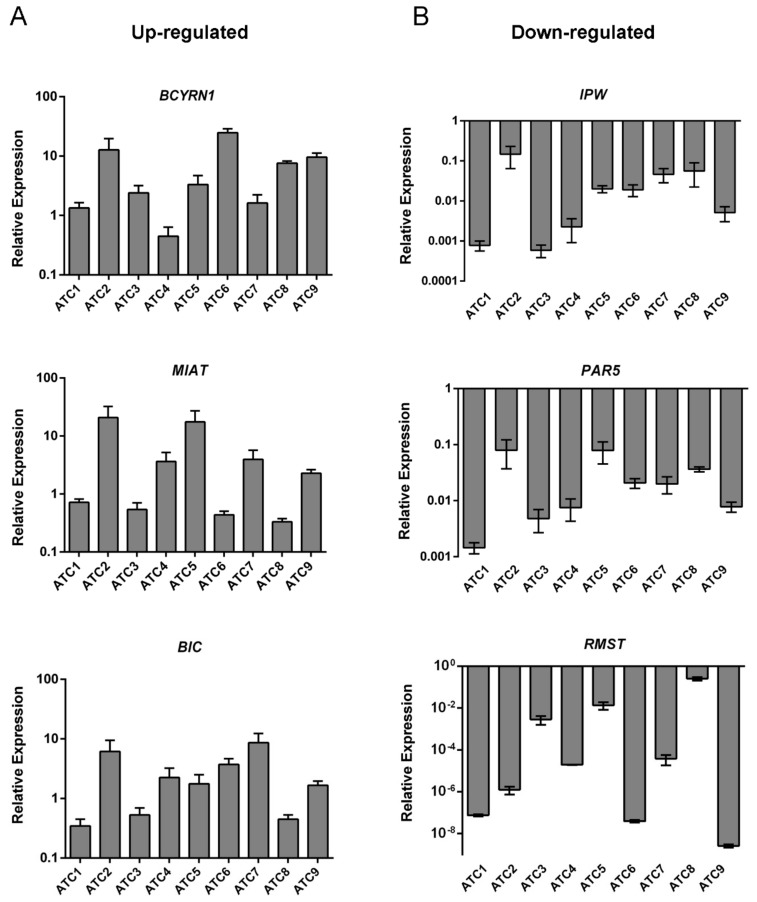
Figure 1.
Expression analysis of lncRNAs deregulated in ATC samples. qRT-PCR analysis was carried out to evaluate the expression levels of three upregulated (A) and three downregulated (B) lncRNAs from the microarray analysis. Results are reported as 2−ΔΔCt values ± standard deviation (SD) compared to the mean of five NT samples, set equal to 1.

