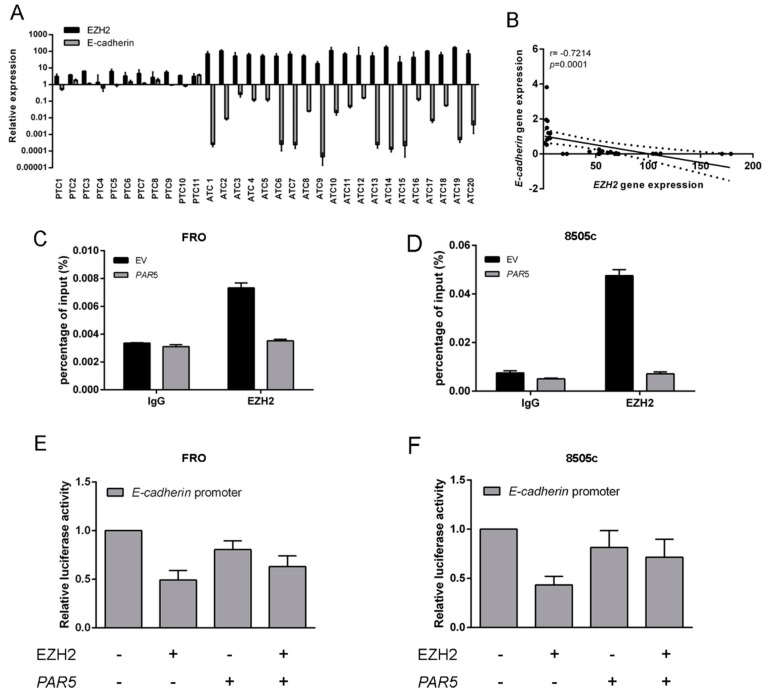
Figure 6.
PAR5 interacts with EZH2 reducing its binding to E-cadherin promoter. (A) qRT-PCR analysis was performed in 11 PTC and 20 ATC samples to evaluate the expression levels of EZH2 and E-cadherin. (B) Correlation scatter plot (Spearman’s Rank) between EZH2 and E-cadherin mRNA levels analyzed in all patient’s carcinoma samples (r = −0.7214; p = 0.0001). (C,D) Chromatin immunoprecipitation (ChIP) assay was carried out in FRO and 8505c cells transiently transfected with PAR5 or the corresponding EV. ATC cell lines were then crosslinked, sonicated, and subjected to pre-clearing. The chromatin was immunoprecipitated using antibodies against EZH2. IgG were used as negative control. The immunoprecipitated chromatin was analyzed by qPCR assay with primers specific for the E-cadherin promoter. (E,F) Luciferase assays performed in ATC cells transfected with the E-cadherin-luc vector and with single or both vectors expressing EZH2 or PAR5. The total amount of the transfected DNA was balanced with the EV. Relative E-cadherin luciferase activity was compared to that observed in cells transfected with the only EV, assuming that the control is equal to 1. Values are the mean of three independent experiments ± SD.

