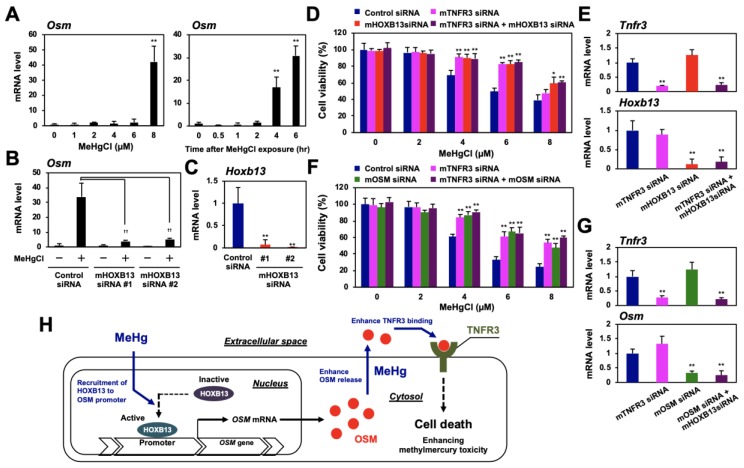
Figure 7.
Involvement of HOXB13, OSM, and TNFR3 in methylmercury toxicity in mouse neural stem cells C17.2. (A) C17.2 cells were exposed to the indicated concentrations of methylmercuric chloride (MeHgCl) for 6 h (left panel) or to 8 µM MeHgCl for the indicated time course (right panel). OSM mRNA levels were determined by qPCR. Representative data indicate relative values, with control as 1, normalized to each GAPDH mRNA level. (B,C) Cells were transfected with two different sequences of mouse (m) HOXB13 siRNAs (#1 or #2) for 48 h. Cells were exposed to MeHgCl (8 µM) for 6 h, and mRNA levels of OSM and HOXB13 were determined. Representative data indicate the relative values, with control as 1, normalized to each GAPDH mRNA level. (D) Cells were transfected with control siRNA, mTNFR3 siRNA, and/or mHOXB13 siRNA (#2) for 48 h and exposed to indicated concentrations of MeHgCl for 24 h. Cell viability was measured by alamarBlue assay. No significant difference was found between mHOXB13 siRNA and mTNFR3 siRNA + mHOXB13 siRNA. (E) Quantitative PCR for TNFR3 (upper panel) or HOXB13 (lower panel) was performed. Representative data indicate the relative values, with control as 1, normalized to each GAPDH mRNA level. (F) Cells were transfected with control siRNA, mTNFR3 siRNA, and/or mOSM siRNA for 48 h and exposed to the indicated concentrations of MeHgCl for 24 h. Cell viability was measured by alamarBlue assay. No significant difference was found between mTNFR3 siRNA and mTNFR3 siRNA + mOSM siRNA. (G) qPCR for TNFR3 (upper panel) or OSM (lower panel) was performed. Representative data indicate the relative values, with control as 1, normalized to each GAPDH mRNA level. All values are mean ± S.D. of three individual experiments. * p < 0.05 vs. control siRNA, ** p < 0.01 vs. control siRNA, †† p < 0.01 vs. MeHgCl-treated control siRNA. (H) Suggested mechanism underlying methylmercury toxicity through the induction of OSM via HOXB13 and OSM binding to TNFR3.

