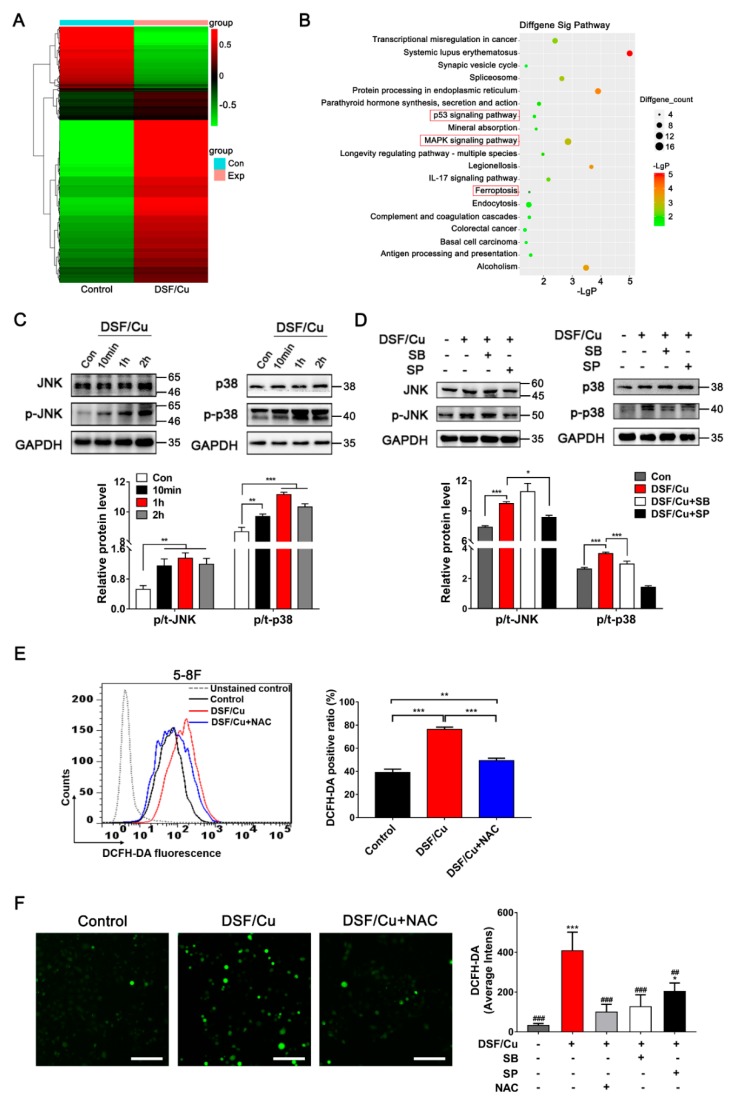
Figure 4.
DSF/Cu induces antitumor activity through a joint action of multiple pathways. (A) Gene expression heatmap showing differentially expressed genes in 5-8F after being exposed to DSF/Cu (1 μM/1 μM) for 4 h. (B) Part of the unregulated significantly differentially expressed gene pathway bubble map; the processing conditions were the same as in (A). (C,D) 5-8F cells were cultured with DSF/Cu (1 μM/1 μM), and the protein expressions were detected by Western blot; the JNK inhibitor SP600125 (10 μM) and p38 inhibitor SB203580 (10 μM) were pretreated 12 h before DSF/Cu was added. Data are shown as means ± SD. * p < 0.05, ** p < 0.01, *** p < 0.001, n = 3. (E) Cellular ROS production in 5-8F treated with DSF/Cu (1 μM/1 μM) and the ROS inhibitor NAC (10 mM) for 5 h was assessed by flow cytometry using DCFH-DA. NAC was pretreated for 12 h. Data are shown as means ± SD. ** p < 0.01, *** p < 0.001, n = 3. (F) Representative images from the High Content screening (HCS) assay of 5-8F cells treated with DSF/Cu, DSF/Cu plus the ROS inhibitor NAC (10 mM) for 5 h. NAC was pretreated for 12 h before DSF/Cu was added. Images with magnification at 10 × are shown here, scale bar: 100 μM. Quantification of cellular ROS levels from the HCS assay are shown as means ± SD. * p < 0.05, *** p < 0.001 vs. control group. ## p < 0.01, ### p < 0.001 vs. DSF/Cu group (the second group), n = 3.

