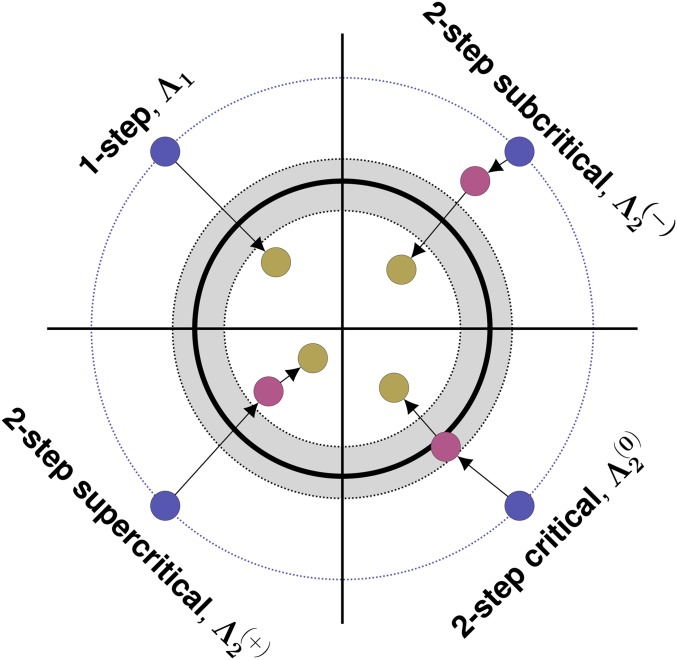
Figure 4.
One- and two-step genetic paths to evolutionary rescue. Here we show an dimensional phenotypic landscape. Continuous-time (Malthusian) growth rate (m) declines quadratically from the center, becoming negative outside the thick black line. The gray zone indicates where growth rates are “sufficiently critical” (see text for details). Blue circles show wild-type phenotypes, red circles show the phenotypes of intermediate first-step mutations, and yellow circles show the phenotypes of rescue genotypes.

