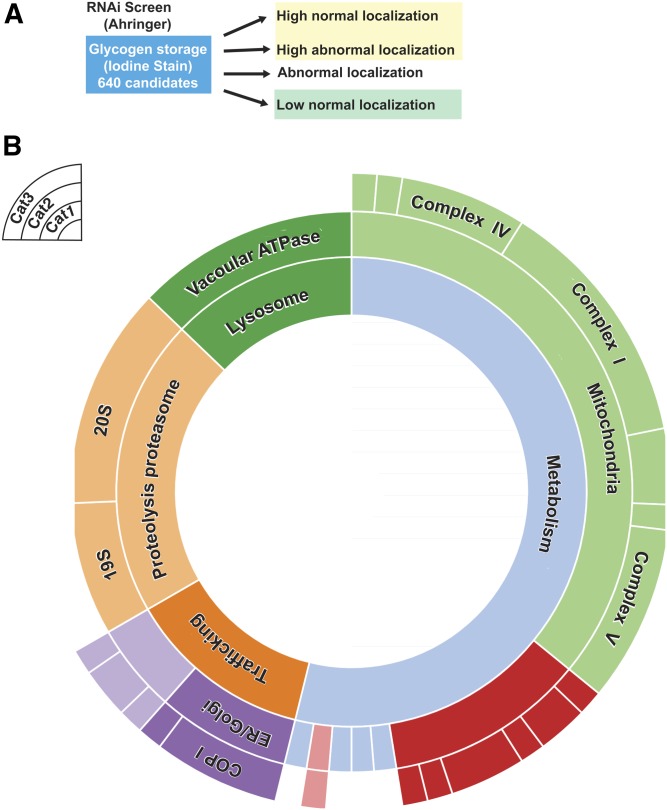
Figure 7.
WormCat analysis of a genome-scale RNAi screen quantitates categories of candidate genes. (A) Schematic of the RNAi screen from LaMacchia et al. (2015) identifying candidate genes that altered glycogen staining. (B) Sunburst diagram from low glycogen candidates showing significantly enriched categories.

