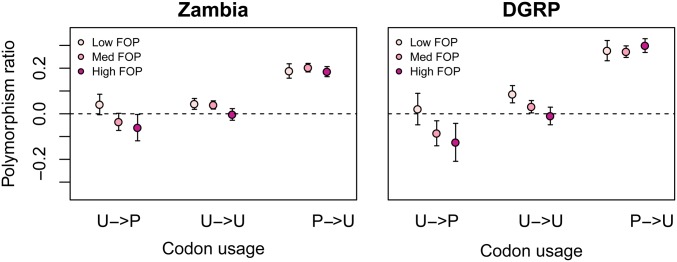
Figure 6.
Polymorphism ratio by class of codon preference and the frequency of preferred codons (FOP). FOP groups are classified into low (lowest quartile), medium (middle two quartiles), and high (top quartile). U: unpreferred; P: preferred. Arrows separate ancestral (pre-arrow) and derived (postarrow) states. Error bars are 2 SE.

