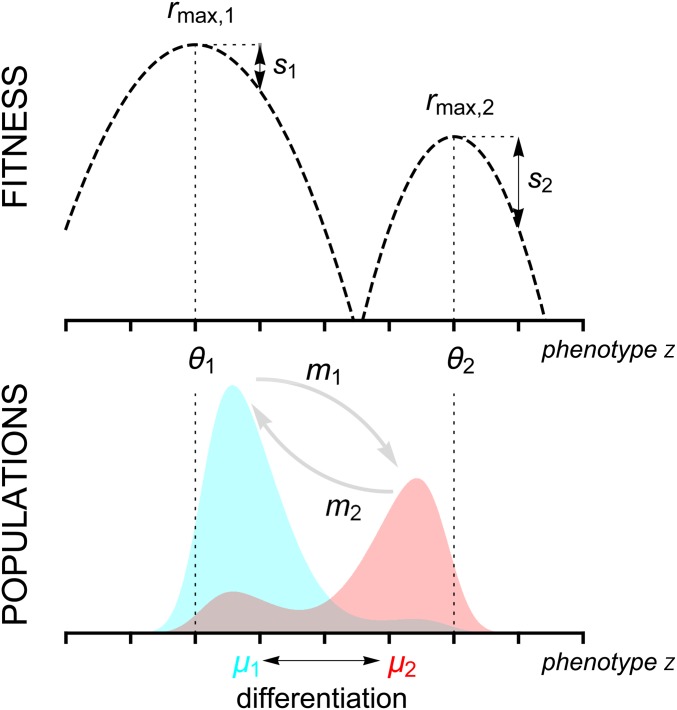
Figure 1.
Schematic representation of the two habitat model. The top figure shows the growth rate (fitness) in each habitat as a function of the phenotypic trait z. In habitat i, the growth rate is assumed to be maximized at and the strength of selection is governed by (see Equation 1). Here, we illustrate a scenario with nonsymmetric fitness functions. The bottom figure shows the phenotypic density in each habitat (light blue and light red in habitats 1 and 2, respectively). Migration from population i is governed by the parameter and tends to reduce the differentiation (i.e., the difference between the mean phenotypes) between populations.

