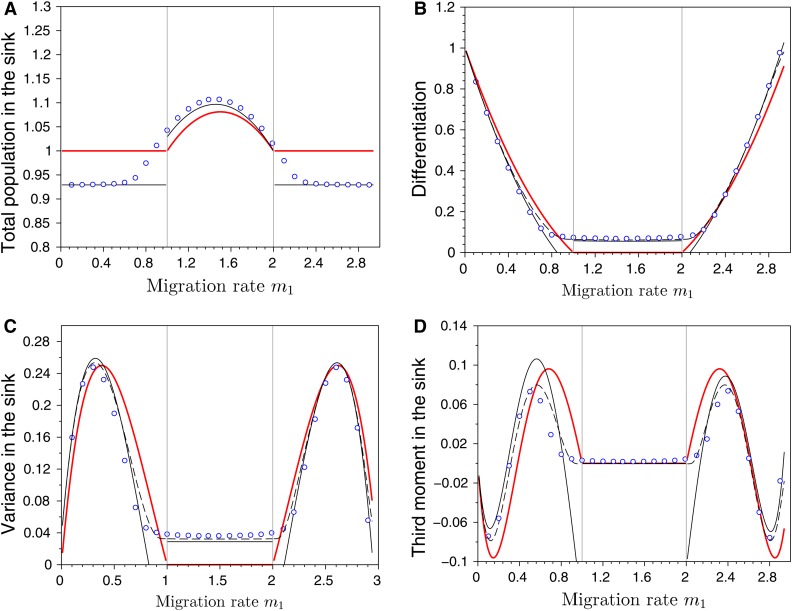
Figure 6.
Effects of migration in a source–sink scenario on (A) the total population size in the sink habitat, (B) the differentiation between habitats, (C) the variance, and (D) the third central moment of the phenotypic distribution in sink. The dots refer to exact numerical computations when , the red line indicates the case where while the lines in black refer to our two approximations when (dashed line for the first approximation and the full line for the second approximation). The vertical gray lines, at and , indicate the critical migration rates where transition occurs between monomorphism and dimorphism in the Adaptive Dynamics framework (see condition Equation 21). Note that both approximations predict the same total population size. Other parameter values: , , , , , , and .

