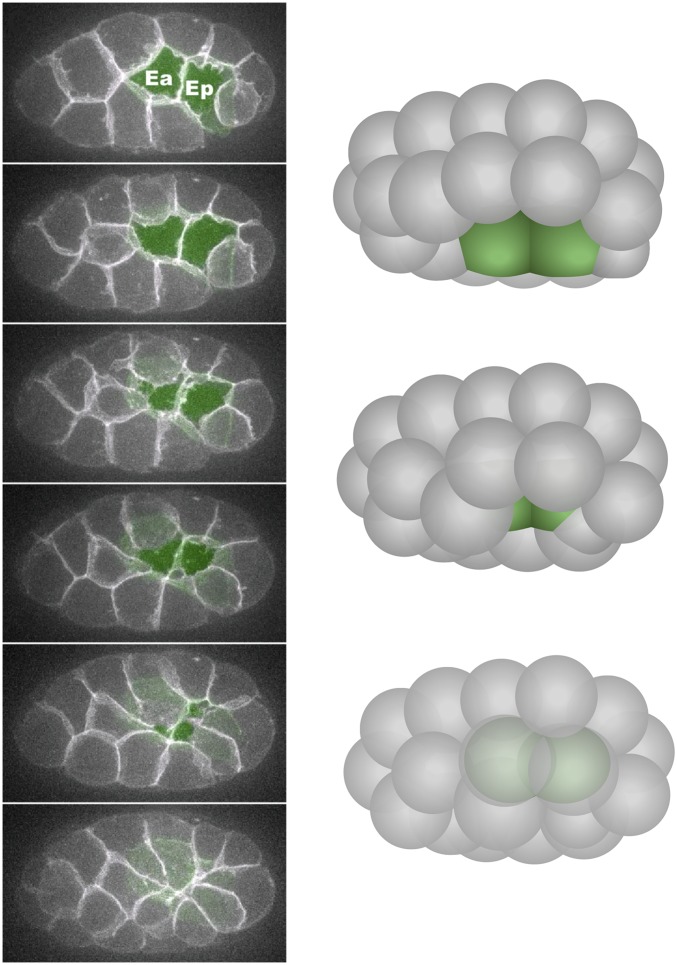
Figure 3.
Endoderm internalization. Left: six frames from a film showing narrowing of the apical surfaces of the endodermal precursor cells (Ea and Ep) from a ventral view (projection of 10 ventral 1-µm z-planes at each timepoint, with endodermal precursor cells false-colored green in each plane). Modified from Roh-Johnson et al. (2012). Right: three-dimensional illustrations of three stages from a ventro–lateral view.

