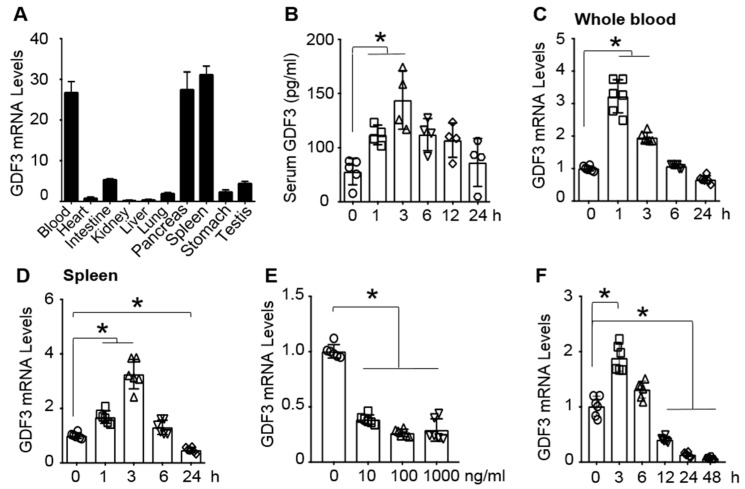
Figure 2.
The dynamic expression of GDF3 in mice and macrophages treated with endotoxin. (A) mRNA levels of GDF3 in different tissues of mice, n = 4. GAPDH gene expression was used as the internal control. (B) Serum GDF3 levels are detected at indicated time points in mice after LPS (10mg/kg) injection (*, p < 0.05; n = 4). mRNA levels of GDF3 were determined in (C) whole blood and (D) spleens of LPS-injected mice (*, p < 0.05; n = 6). (E) LPS-dose response and (F) time course of GDF3 expression in BMDMs, where indicated, (E) total RNAs were collected at 24 h after LPS exposure (*, p < 0.05) and (F) BMDMs were pre-treated with LPS (10 ng/mL) (*, p < 0.05; n = 4). Similar results were obtained in other two independent experiments.

