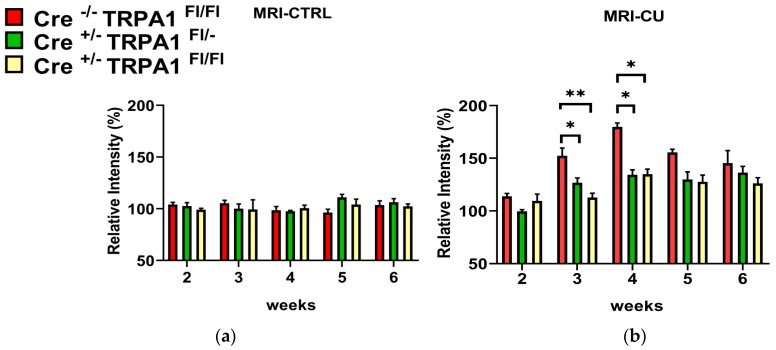
Figure 3.
Changes of signal intensity in the medial corpus callosum measured by magnetic resonance imaging between week 2 and 6 of cuprizone treatment in (a) control (CTRL) and (b) cuprizone-treated (CU) groups of GFAP-Cre−/− TRPA1Fl/Fl, GFAP-Cre+/− TRPA1Fl/− and GFAP-Cre+/− TRPA1Fl/Fl mice. Data are means ± S.E.M. of images obtained from animals (n = 4/group). The signal intensities were normalized to the baseline values (100%) for each animal and indicated by percentages of relative intensity. Asterisks show statistically significant differences between respective CU and CTRL groups (* p < 0.05, ** p < 0.01).

