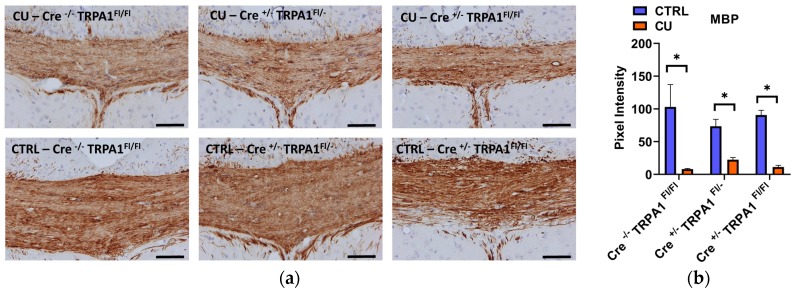
Figure 5.
Evaluation of myelin content with myelin basic protein (MBP) immunohistochemistry after 6 weeks of cuprizone treatment (a). Representative images of control (CTRL) and cuprizone-treated (CU) groups in GFAP-Cre−/− TRPA1Fl/Fl, GFAP-Cre+/− TRPA1Fl/− and GFAP-Cre+/− TRPA1Fl/Fl mice.; (b) Pixel intensities of diaminobenzidine staining in the middle part of the corpus callosum in each group, *p < 0.05, n = 3–5/group, Scale bar = 100 µm.

