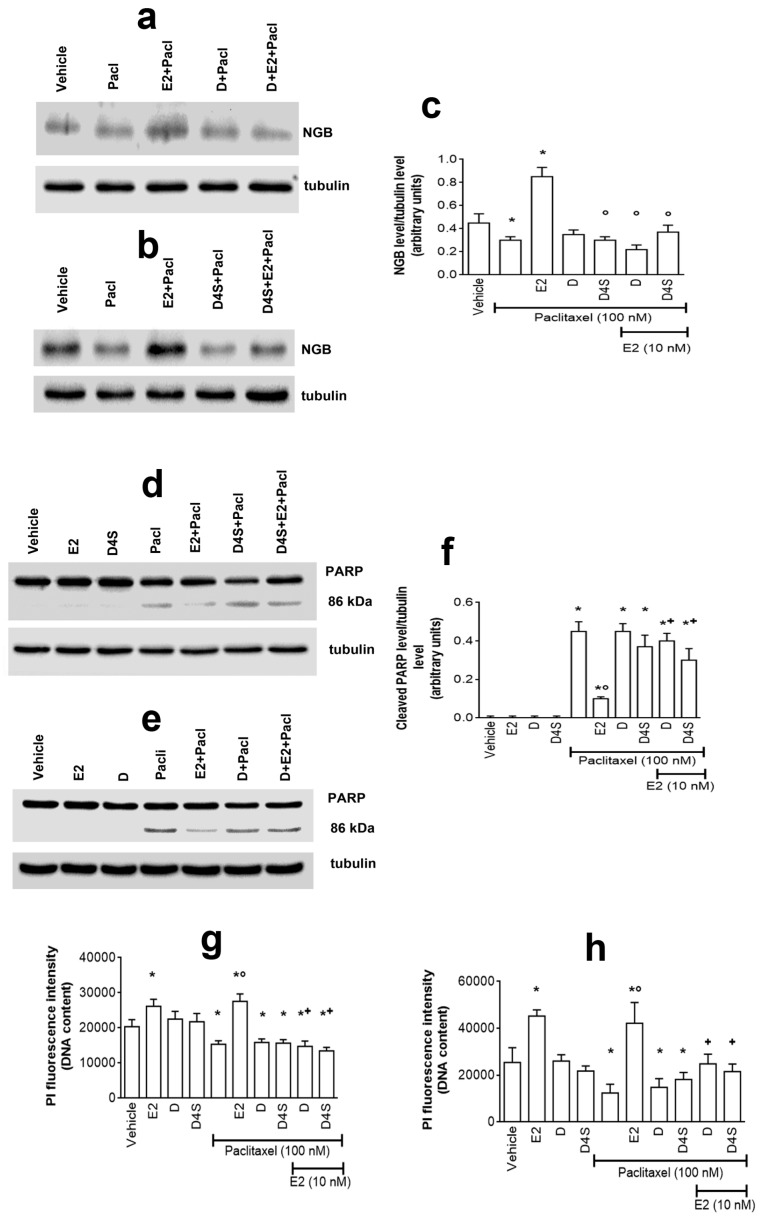
Figure 5.
Physiological outcomes of D- and D4S-induced E2/ERα/NGB pathway avoidance. Western blot (left) and densitometric analyses (right) of NGB levels (a–c) and PARP-1 cleavage (d–f) in MCF-7 cells. Cells were treated with D (a,e) or D4S (b,d) (1 μM) in presence or absence of Pacl (100 nM) for 24 h, with either vehicle or E2; some Pacl treated cells were co-stimulated with either E2 or D or E2 together with D (a,e) or E2 or D4S or E2 together with D4S (b,d). (c,f) panels are densitometries that summarize the D- and D4S-induced modulation of NGB and PARP-1 cleavage respectively. The amount of protein was normalized by comparison with tubulin levels. Data are the mean ± SD of three different experiments. p < 0.001 was determined with Student t test with respect to the vehicle (*), Pacl-treated (°) samples or D- and D4S-treated samples, co-stimulated with Pacl but not with E2 (+). Effects of cellular DNA content obtained from PI assay on MCF-7 (g) or T47D (h) cells. The cells were treated for 24 h with either vehicle (DMSO) or E2 (10 nM) or Pacl (100 nM; 24 h); some samples were treated with D or D4S (1 µM) in presence or absence of Pacl and in presence of absence of E2. Data are mean ± SD of five different experiments. (*) p < 0.001 was calculated with Student t test versus vehicle or Pacl-treated (°) samples or D- and D4S-treated samples, co-stimulated with Pacl but not with E2 (+). E2: estradiol; NGB: neuroglobin; DMSO: dimethyl sulfoxide; D: daidzein; Eq: equol; D4S: daidzein-4′-sulfate; Pacl: paclitaxel.

