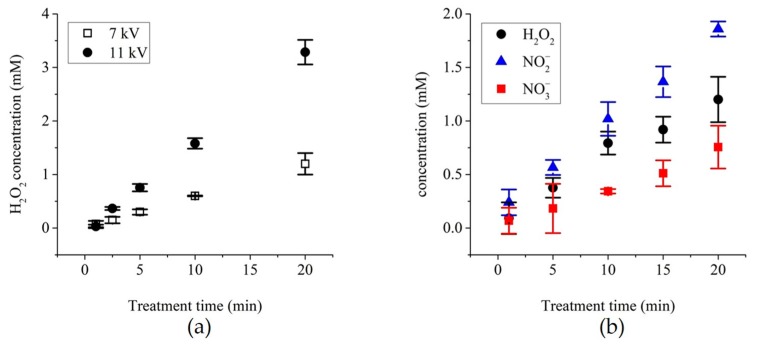
Figure 2.
Chemical analysis of the plasma-treated PBS (pPBS) prepared with the NTP multi-jet source using (a) NTP setup 1 and (b) NTP setup 2. (a) The evolution of the concentration of H2O2 in +7 kV- and +11 kV-pPBS as a function of the treatment time with the plasma, (b) Dosimetry of H2O2, NO2−, and NO3− levels in PBS+/+ treated during 20 min. at +11 kV. Data are presented as mean values ± SD of independent duplicates ((b): 1, 5, and 15 min.) or triplicates (all other points).

