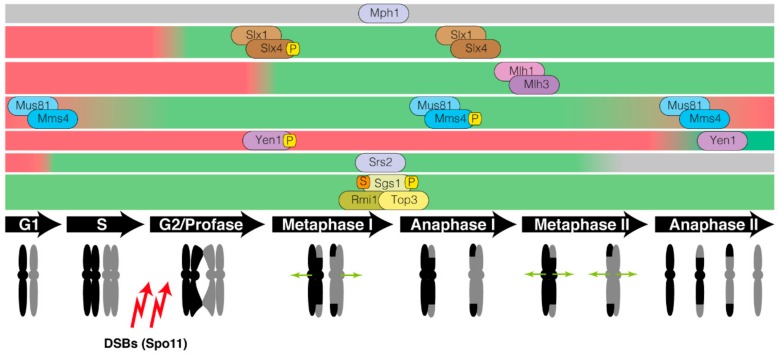
Figure 3.
Schematic representation of the temporal regulation of enzymatic complexes involved in the processing of recombinant structures in the meiotic program. The diagraph represents the temporal activation (green bars) and inactivation (red bars) of each complex during meiosis. Different post-translational modifications, such as phosphorylation (P), SUMOylation (S) and ubiquitylation (U) are portrayed. Green and red bars represent active and inactive states, respectively. Grey bar denotes lack of information related to the temporal regulation of the enzymatic complex.

