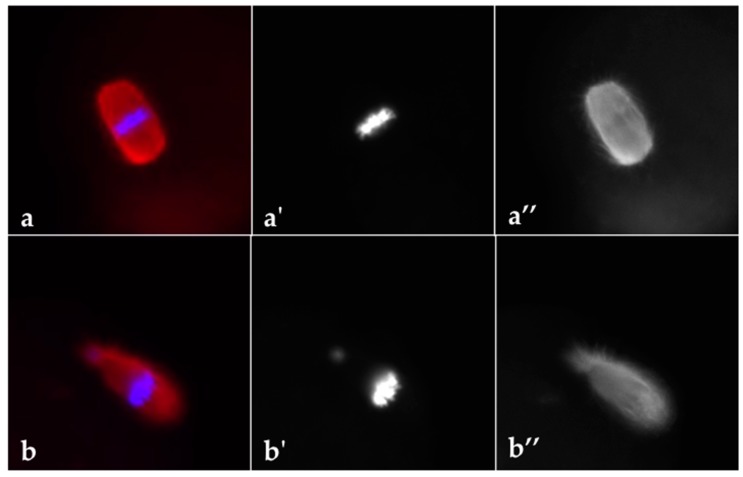
Figure 3.
Representative images of MII plate observed in oocytes from control (a–a’’) and DHEA (b–b’’) mice following induction of ovulation. Spindle is stained by α-tubulin (red) and chromosomes are stained by Hoechst 33342 (blue). Five mice per experimental group were employed. Experiments were done in triplicate.

