Figure 7.
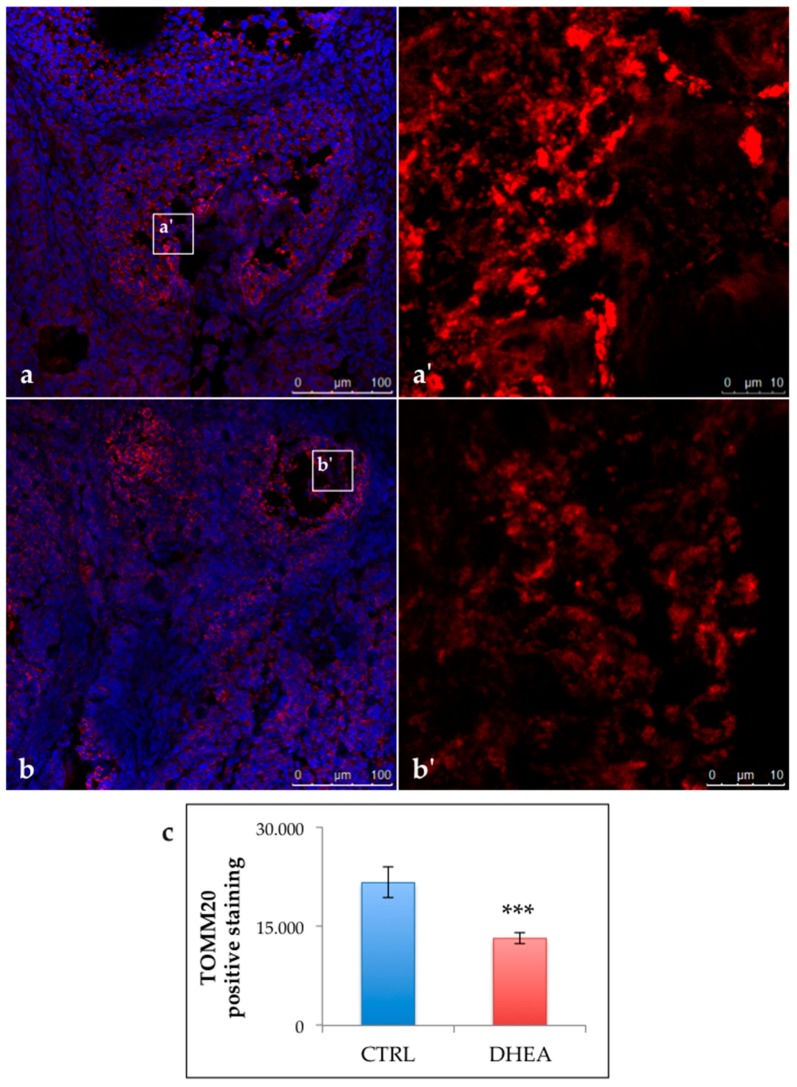
Immunolocalization and quantification of translocase of outer mitochondrial membrane 20 (TOMM20) positive staining (red). DNA is stained by DAPI (blue). Representative images of TOMM20 in CTRL (a,a’) and DHEA (b,b’) mice. Quantification of TOMM20 positive staining in the experimental groups (c). Data are presented as means ± SEM of mean pixel intensity of red fluorescence. Three mice per experimental group were employed. Experiments were done in triplicate. ***, p < 0.001, t-test.

