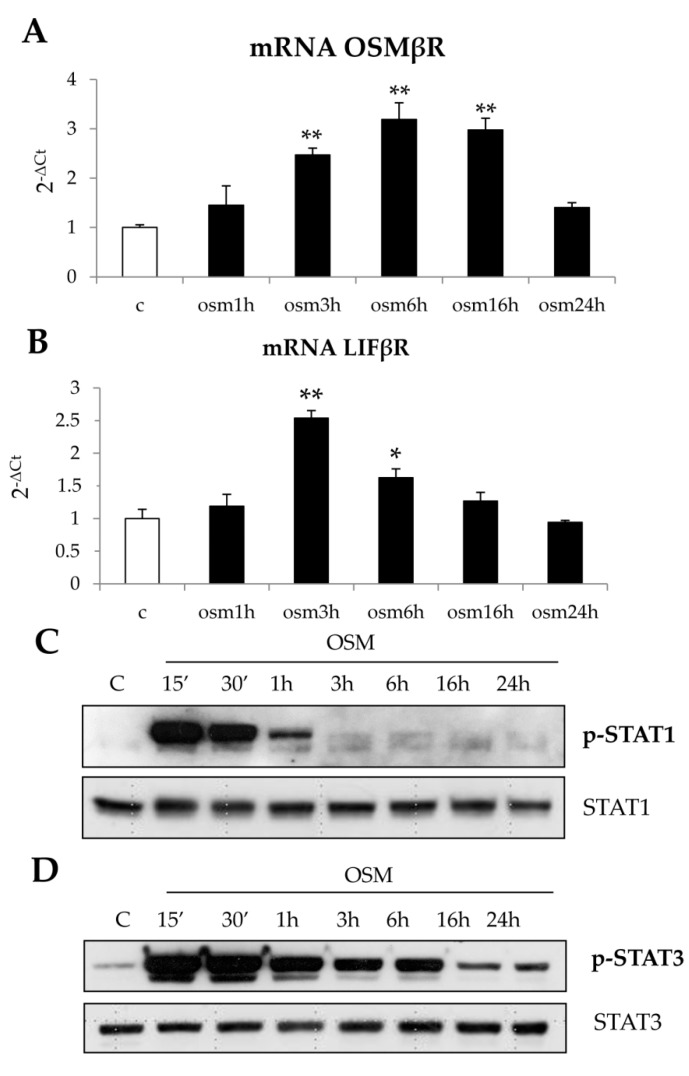
Figure 4.
(A–D) Involvement of both OSM-receptors, OSMβR and LIFβR, as well as of STAT1 and STAT3 signal pathways in LX2 cells in response to hrOSM. Quantitative real time PCR (q-PCR) analysis of OSMβR (A) and LIFβR (B) transcript levels was performed in LX2 cells exposed to hrOSM 10 ng/mL up to 24 h. Data are expressed as means ± SEM of three independent experiments. * p < 0.05, ** p < 0.01 versus control value. Western blotting analysis of phosphorylated STAT1 (C) and STAT3 (D) in LX2 cells exposed to hrOSM 10 ng/mL (starting from 15 min up 12 h). Equal loading was confirmed by-reprobing the same membrane with the un-phosphorylated protein.

