Figure 6.
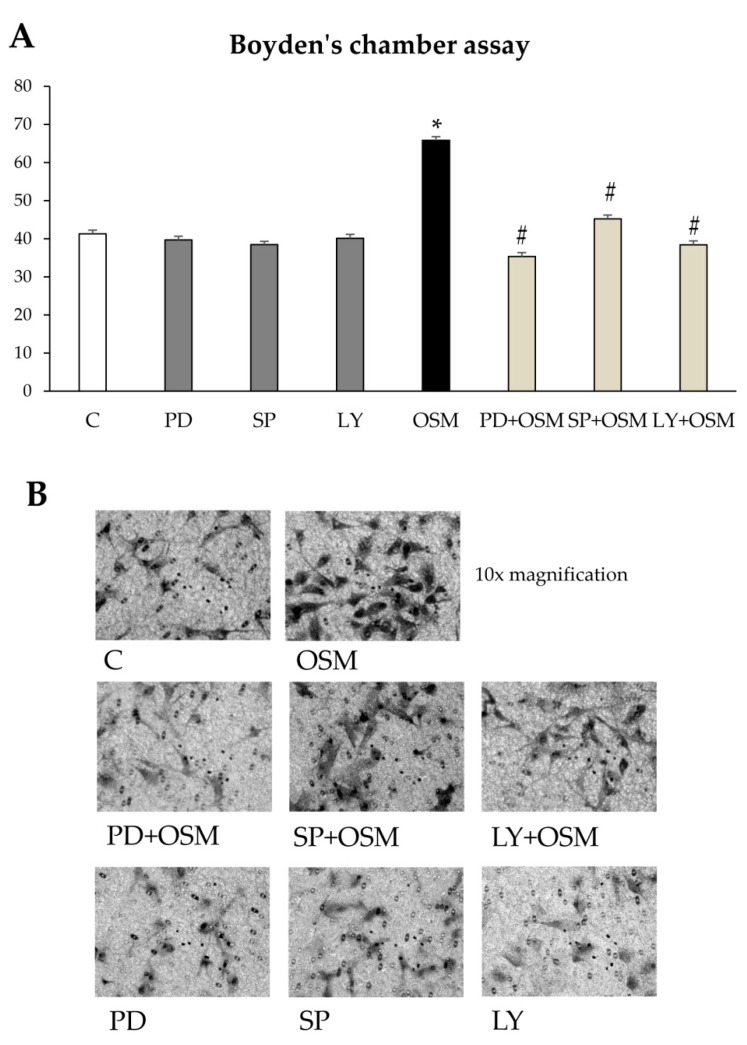
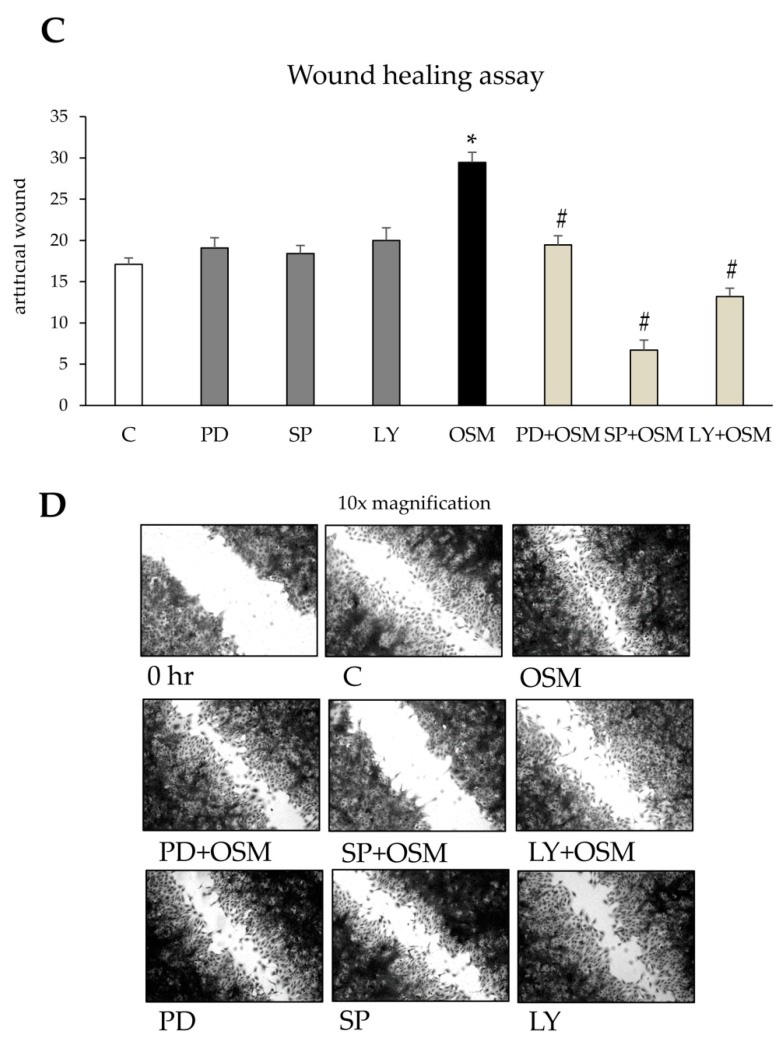
(A,B) Involvement of signal transduction pathways in the modulation of OSM-dependent migration of LX2 cells. Boyden’s chamber assay (A) was performed on LX2 cells exposed to hrOSM 10 ng/mL for 6 h. In some experimental conditions LX2 cells were pre-treated for 30 min with specific pharmacological inhibitors PD98059 (MEK-1 inhibitor), SP600125 (JNK 1/2 inhabitor), LY294002 (Akt inhibitor) and then exposed or not to hrOSM 10 ng/mL for 6 h. Data in bar graphs represent mean ± SEM (n = 3, in triplicate). * p < 0.05 versus control value; # p < 0.05, versus OSM value. (B) Representative images of cells on filter from Boyden’s chamber assay stained with crystal violet. Original magnification is indicated. (C,D) Involvement of signal transduction pathways in the modulation of OSM-dependent migration of LX2 cells. Wound healing assay (C) was performed on LX2 cells exposed to hrOSM 10 ng/mL for 20 h. In some experimental conditions LX2 cells were pre-treated for 30 min with specific pharmacological inhibitors PD98059 (MEK-1 inhibitor), SP600125 (JNK 1/2 inhibitor), LY294002 (Akt inhibitor) and then exposed or not to hrOSM 10 ng/mL for 20 h. Data in bar graphs represent mean ± SEM (n = 3, in triplicate). * p < 0.05 versus control value # p < 0.05, versus OSM value. (D) Representative images of cells invading the artificial wound stained with crystal violet. Original magnification is indicated.


