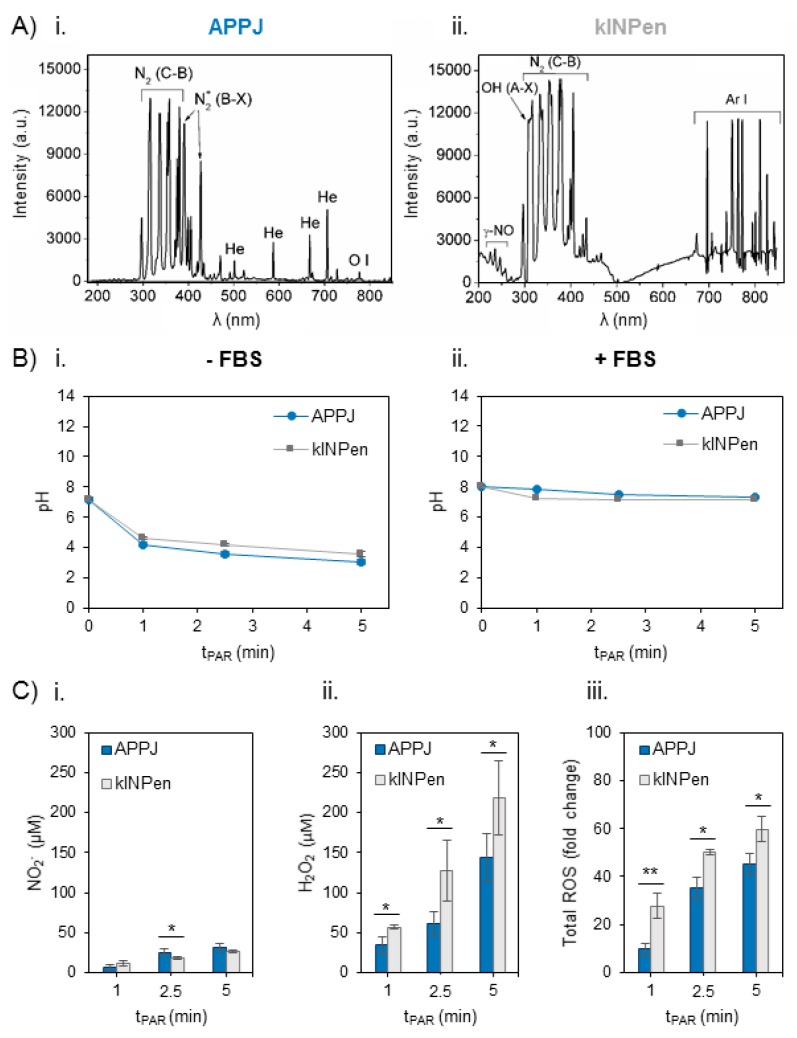
Figure 1.
Reactive oxygen and nitrogen species in the plasma gas phase and time-dependent concentration generated in Ringer’s saline at 1 L/min of gas flow, 10 mm of distance between the nozzle of the plasma jet and the surface of the liquid (2 mL in 24 well-plates). (A) Optical Emission Spectra (OES) of the plasma gas phase in (Ai) atmospheric pressure plasma jet (APPJ) and (Aii) kINPen during treatment of Ringer’s saline. (B) pH evolution in Ringer’s saline treated by APPJ and kINPen at increasing treatment time (Bi) without and (Bii) with addition of 10% FBS after treatment. (C) Concentration of (Ci) NO2−, (Cii) H2O2 and (Ciii) total reactive oxygen species (ROS) measured in situ and relativized to untreated plasma-activated Ringer’s saline (PAR). Reactive oxygen and nitrogen species (RONS) created by both plasmas in 2 mL of Ringer’s saline were measured right after plasma treatment and addition of 10% of FBS. Asterisks represent statistically significance differences between APPJ and kINPen for each time-point (n = 3; * p-value < 0.05; ** p-value < 0.01; two-sided Student’s t-test).

