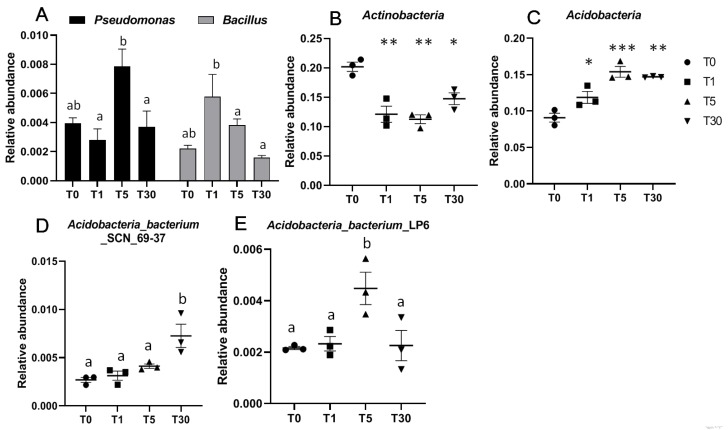
Figure 5.
Relative abundance of bacteria in the four different groups. (A) Relative abundance of two beneficial bacteria, including Pseudomonas and Bacillus, were compared for the four groups; (B) beneficial bacterial phylum Actinobacteria; (C) phylum Acidobacteria; (D,E) two Acidobacteria bacteria Acidobacteria_bacterium_SCN_69-37 and Acidobacteria_bacterium_LP6. a and b represent significant differences (p < 0.05); Significances between different groups were compared using a one-way ANOVA test, with the results indicated on the top (p-value ≤ 0.05 = *, p-value ≤ 0.01 = **, and p-value ≤ 0.001 = ***).

