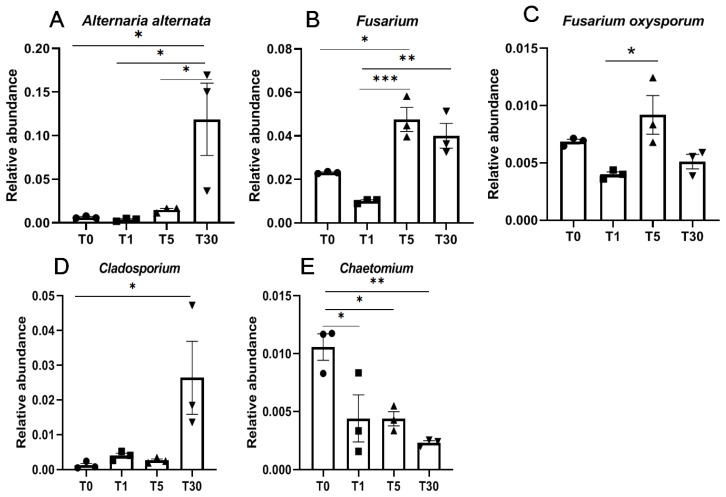
Figure 6.
Relative abundance of beneficial and pathogenic fungi. (A,C) Pathogenic fungi species; (B,D) pathogenic fungi genera; (E), beneficial fungus. Significance between different groups were compared using a one-way ANOVA test, with the results indicated on the top (p-value ≤ 0.05 = *, p-value ≤ 0.01 = **, and p-value ≤ 0.001 = ***).

