Figure 3.
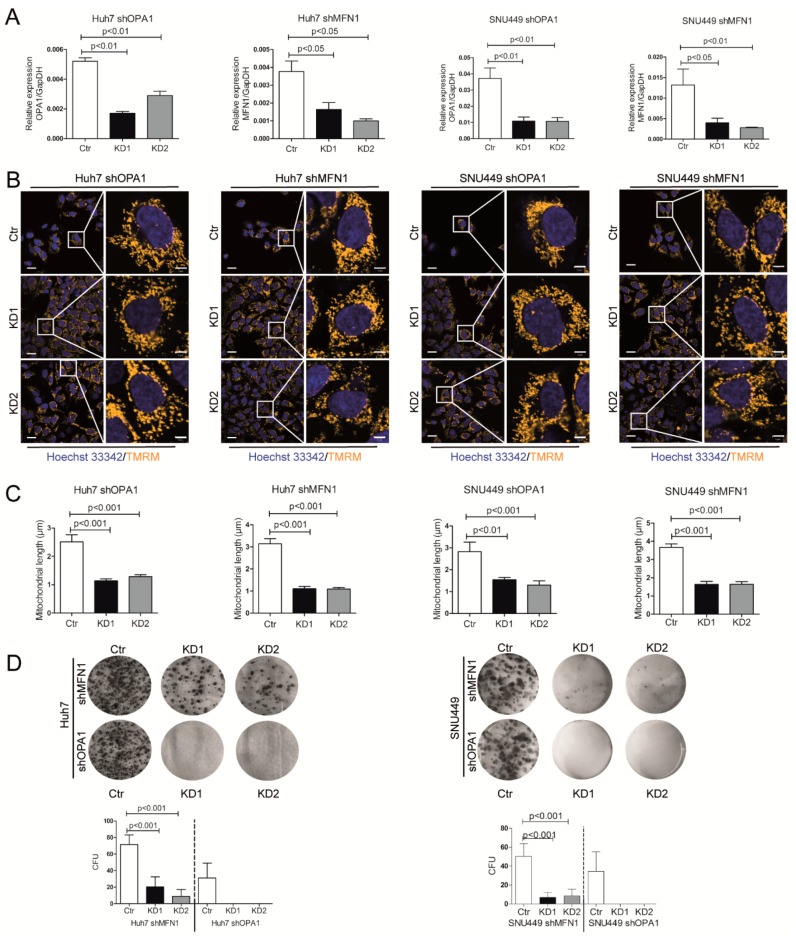
Knockdown of OPA1 or MFN1 inhibits mitochondrial fusion. Inhibition of mitochondrial fusion attenuates cancer cell growth in vitro. (A) Real-time PCR analysis of OPA1 expression in Huh7/SNU449 shOPA1 cells and MFN1 expression in Huh7/SNU449 shMFN1 cells. Huh7/SNU449 shOPA1 cells were transfected with mock lentivirus (Ctr) and shOPA1 lentivirus (KD1 and KD2) respectively. Huh7/SNU449 shMFN1 cells were transfected with mock lentivirus (Ctr) and shMFN1 lentivirus (KD1 and KD2) respectively. Gene knockdown efficiency was quantified (n = 6). (B) Representative confocal images of mitochondria with TMRM staining in live cells with OPA1 and MFN1 knockdown respectively. The white boxed regions were further magnified in the expanded images (right row). Scale bar = 20 µm (left row). Scale bar = 5 µm (right row). (C) Quantified measurements of mitochondrial length in control and KD cells (n = 3 images/sample). (D) Representative images of colony formation assay of Huh7/SNU449 shOPA1 cells and shMFN1 cells. Cells were fixed and stained by Giemsa (n = 9). The number of colony forming units (CFU) was quantified by ImageJ software. Histograms show means ± SEM with p value by Mann Whitney test.

