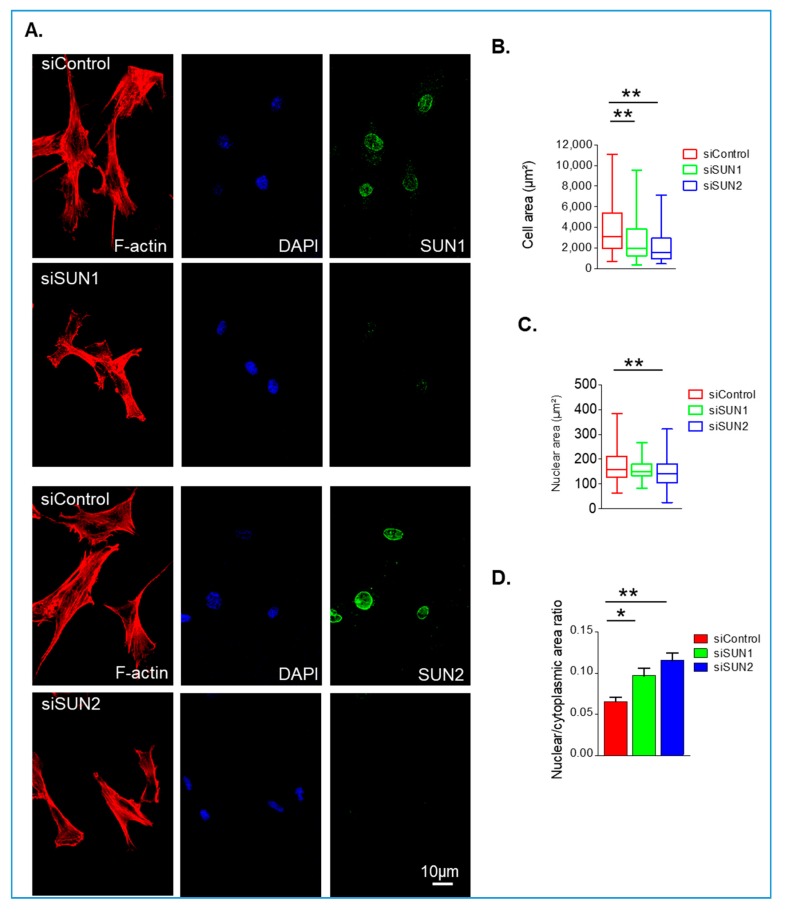
Figure 2.
SUN1 and SUN2 influence isolated VSMCs spreading. (A) Representative confocal immunofluorescence microscopy images of rhodamine phalloidin (red), SUN1 or SUN2 (green), and DAPI (blue) stained VSMCs grown on 12 kPa hydrogels. Graphs show IF analysis of (B) cell area, (C) nuclear area, and (D) nuclear area:cytoplasmic area ratio of control, SUN1- and SUN2-depleted VSMCs. Graphs represent combined data of three independent experiments analysing >300 cells per group (* p < 0.05 and ** p < 0.01).

