Figure 3.
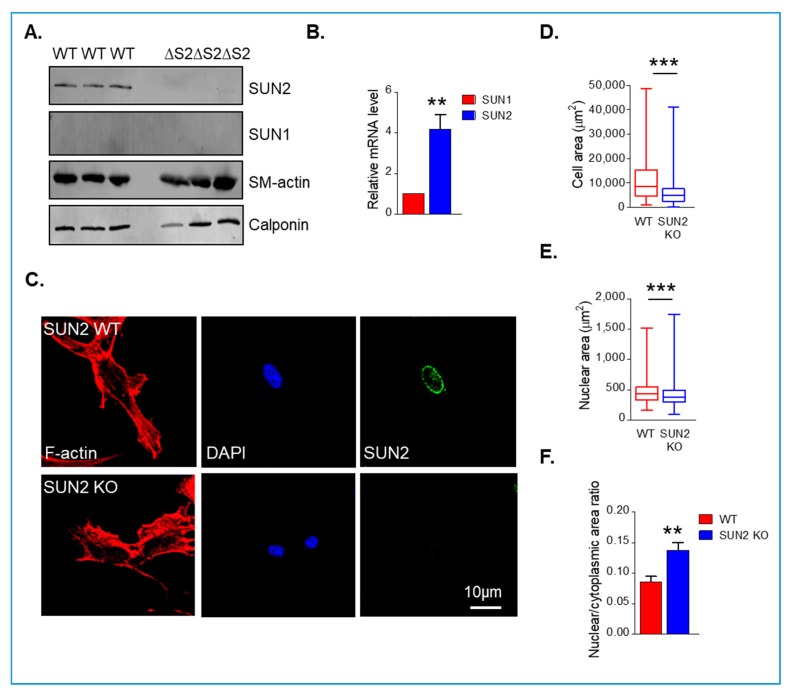
SUN2 KO VSMCs display reduced spreading. (A) WB of wild-type (WT) and SUN2 KO aortic samples. Each lane corresponds to an independent aortic sample isolated from different WT and SUN2 KO mice. (B) qPCR analysis of SUN1 and SUN2 mRNA expression in WT aortae. (C) Representative images of isolated WT and SUN2 KO mouse aortic VSMCs stained for F-actin (red), SUN2 (green), and DAPI (blue). Graphs show (D) cell area, (E) nuclear area, and (F) nuclear area:cell area ratio of WT and SUN2 KO VSMCs. Graphs represent the combined data of three independent experiments analysing >200 cells per group (** p < 0.01 and *** p < 0.0001).

