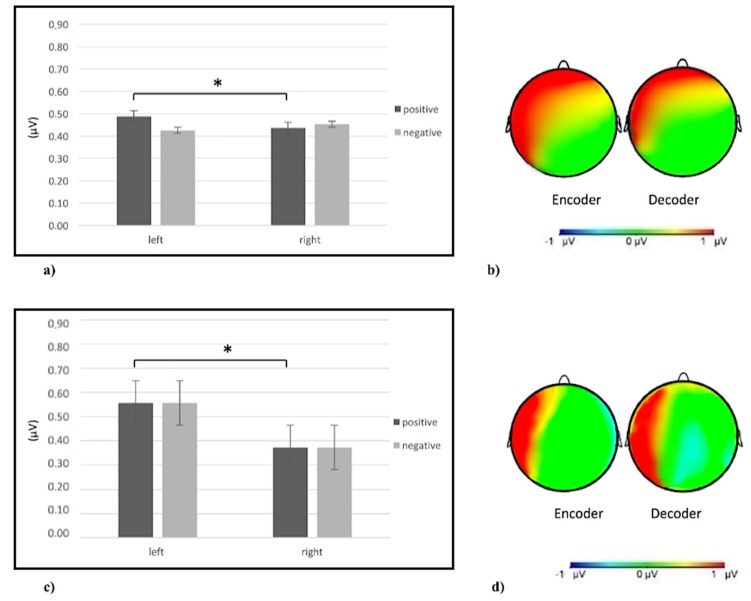
Figure 5.
(a) Histogram of theta brain activity for positive and negative gestures in the left and right side. The figure shows an increase of theta power for positive gestures in the left side compared to the right one. Bars represent ∓1SE. Stars mark statistically significant (p < 0.05) pairwise comparisons. (b) Theta inter-brain connectivity representation, from left to right, for positive gestures in the encoder and decoder. The red area represents an increase of theta inter-brain connectivity. (c) Histogram of beta brain activity for positive and negative gestures for the left and right side. The figure shows an increase of beta power for positive gestures for the left side compared to the right one. Bars represent ∓1SE. Stars mark statistically significant (p < 0.05) pairwise comparisons. (d) Beta inter-brain connectivity representation, from left to right, for positive gestures in the encoder and decoder. The red area represents the increase of beta inter-brain connectivity.

