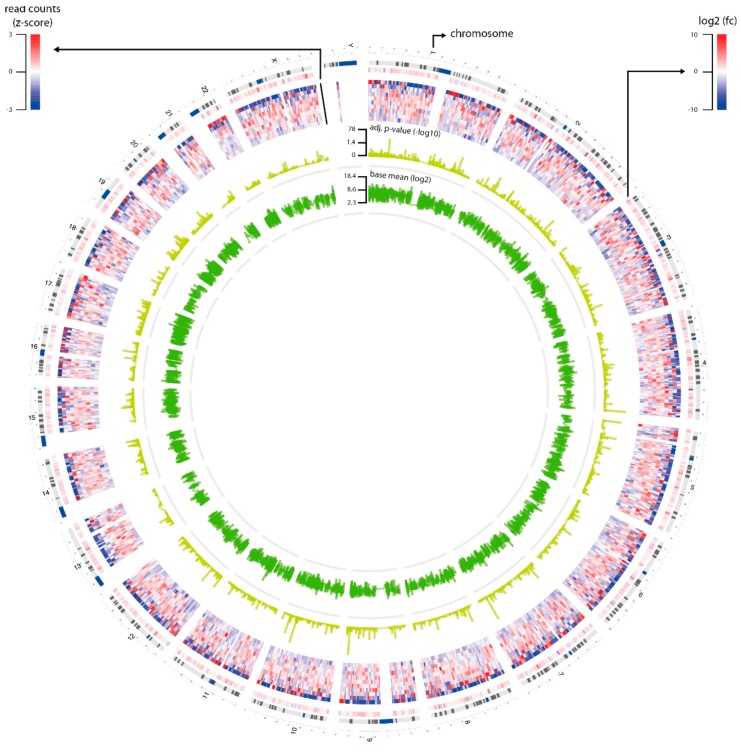
Figure 1.
Overview of RNA sequencing data. The circus plot shows statistics of the genes (n = 16,672) that were selected for differential gene expression analysis. The plot contains four circles: Layer 1 is log2fold-change of the genes; Layer 2 is read counts of the genes that were transformed to z-score; Layer 3 is adjusted p-value of the genes that were transformed by–log10; and Layer 4 is the base mean of the genes that were transformed by log2.

