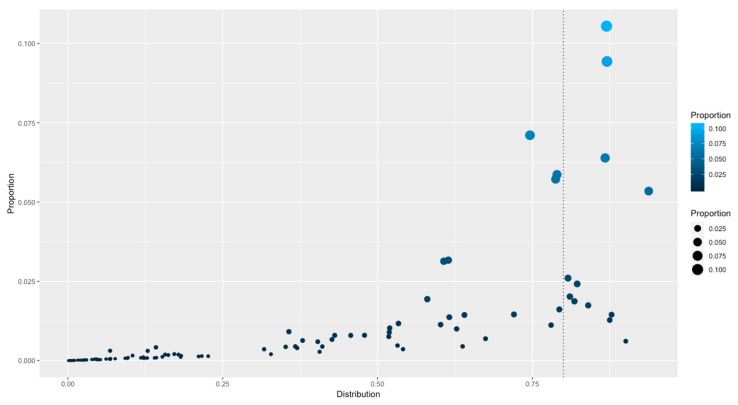
Figure 3.
Distribution of TF families among all the genomes. The X-axis indicates the distribution (as a percentage) of genomes with members of a given family. 0 represents absence of a family and 1 means that a family is distributed along all the organisms. The Y-axis indicates the proportion of families versus the total of TFs identified. The vertical dotted line indicates those families identified in more than 80% of organisms.

