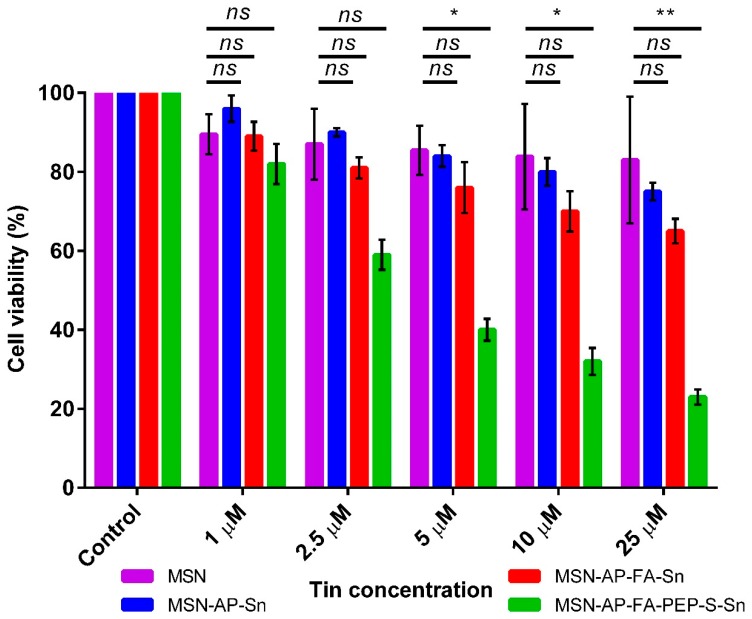
Figure 6.
MTT viability assay of MDA-MB-231 cells after incubation with different concentrations of the MSN nanomaterials. All the results were expressed as % of control (mean ± SD, n = 3 independent experiments and 3 replicates/experiment). Significance was calculated by one-way ANOVA Tukey’s test. ns: p > 0.05 or not significant statistical difference between the groups of data; *: p < 0.05 or significant statistical difference between the groups of data; **: p < 0.01 or significant statistical difference between the groups of data.

