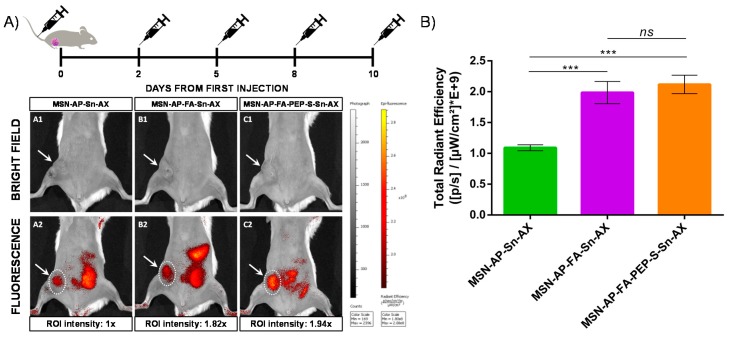
Figure 9.
(A) In vivo fluorescence imaging of mice treated with different nanoparticles at endpoint: A: MSN-AP-Sn-AX (AX-1); B: MSN-AP-FA-Sn-AX (AX-2); C: MSN-AP-FA-PEP-S-Sn-AX (AX-3). Row 1 (A1, B1, and C1) corresponds to representative bright field images to visualize the tumor area (white arrows) and row 2 (A2, B2, and C2) corresponds to representative fluorescence images acquired 2 h post-injection of nanoparticles. The applied ROI areas used for signal intensities comparison are all equal and marked with white dotted lines. (B) Total in vivo fluorescence accumulated in the mice tumor treated with different nanomaterials at end point (n = 3 for each group). The applied ROI area was the same in each case. Significance was calculated by unpaired t-test of one-way ANOVA. ns: p > 0.05 or not significant statistical difference between the groups of data; ***: p < 0.001 or highly significant statistical difference between the two groups of data.

