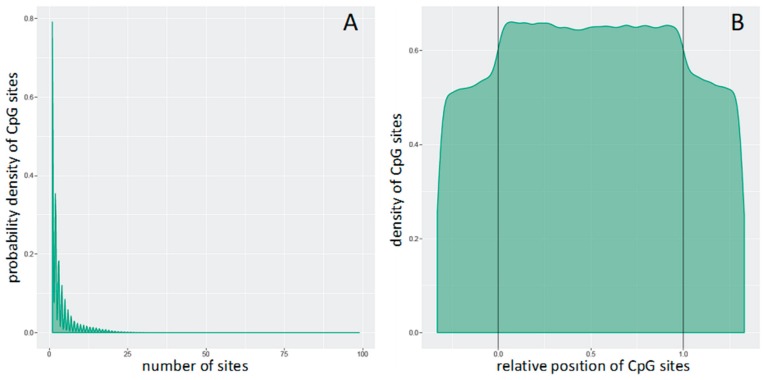
Figure 1.
Distributions of CpG sites (A) per genomic tiling region and (B) across genomic tiling region. In Panel B, the relative coordinates of 0 and 1 correlate to the start and end coordinates of the genomic tiling region. Those coordinates that are smaller than 0 and larger than 1 indicate flanking regions normalized by region length.

